

It is useful to start with simple truths when we consider the value of users to Netflix’s capital accumulation. To accumulate revenues, Netflix needs users — either to pay a subscription fee or to be the captive audience for advertising. Moreover, if revenues per user do not increase, such as from price inflation, Netflix will always want the number of users on the platform to increase.
The ease with which we grasp these truths is a reflection of our familiarity with businesses that rely on the personal expenditures of individuals and households. Unlike firms in sectors like manufacturing or engineering, you do not need to learn about bids, procurement, or supply chains to understand the basic relationship between Netflix’s financial performance and its users. You, me, friends, neighbours, and strangers pay Netflix for entertainment from personal income. If we stop paying for Netflix, or even stop watching it, its main streams of revenues suffer.
It also appears easy to extend beyond these truths and conceptualize the economic value of user experience. As two employees of Netflix describe, user experience on the streaming platform influences the in-out flows of new and old users:
Revenue is proportional to the number of members, and three processes directly affect this number: the acquisition rate of new members, member cancellation rates, and the rate at which former members rejoin.
If we create a more compelling service by offering better personalized recommendations, we induce members who were on the fence to stay longer, and improve retention. In addition, all members with an improved experience (not just those on the fence) may be more enthusiastic when describing Netflix to their friends, strongly influencing new subscriber acquisition through word-of-mouth effects (Gomez-Uribe & Hunt, 2015, p. 8).
But does this conceptual extension explain capital accumulation just as well as the simple truths about Netflix’s need for users? Or does it only appear to do so?
What can look like a straightforward truth about the economics of user experience — e.g., Netflix needs positive user experiences for financial success — can also be complicated with follow-up questions:
- Do characteristics of user experience have measurable effects on Netflix’s financials?
- Are the economic effects of user behaviour proportional to the size or change of a characteristic? For example, is more value created because users are spending more time on Netflix?
These questions probe the relationship between Netflix’s prices — its revenues, profits, etc. — and its so-called “real” economic value. Academic research on Netflix generally ignores these questions, but considering that so much of modern economics, both neoclassical and Marxist, starts from the premise that nominal prices are reflections of economic value, this is not surprising. For example, the price/value relationship is unexamined when it is assumed that we already know how Netflix’s financials reflect user experience:
Riding the momentum of growth in the late aughts, Netflix’s streaming lore reiterates its central narrative that user value in terms of experience translates to the potentiality of shareholder value over time (Crawford, 2021, p. 59).
Other research will focus on the features and technologies of the Netflix user experience so intensely that a piece of writing could have hardly any statements about financial performance. For example, the details and evolution of Netflix’s recommendation algorithms can be studied without any significant claims about how these algorithm’s make Netflix any money (Frey, 2021). Yet questions about the price/value relationship are still relevant to these types of studies, even if it appears there is little cost to ignoring them. The choice to research the culture or technology of Netflix’s user experience is influenced by Netflix’s position as a business, relative to Hollywood studios and other streaming platforms. Even if an article or book refrains from stating that Netflix’s algorithm translates to shareholder value, is it inconsequential that this algorithm is a key component of a company that has been part of the S&P 500 for over 15 years?
The consequences of ignoring questions about the price effects of user experience are both empirical and theoretical. It is best to investigate the empirical dimension first and explore what can be demonstrated with available data. Because if there are limitations in the data or if statistical relationships between users and financials are weaker then we thought, a value theory of user experience might already be off to a rough start.
Variables for measuring correlations
Our empirical investigation will test combinations of relationships between Netflix’s users and the firm’s financial performance. These tests will not only help us gauge the strength of these relationships. They also demonstrate that the availability of data matters. Imagining the ways user experience is good for Netflix’s financials is one thing; it is another thing for researchers, analysts, shareholders, and a curious public to actually have data to test theories of user experiences on the Netflix platform.
Table 1 catalogues the variables that measure user characteristics and those that measure financial performance.
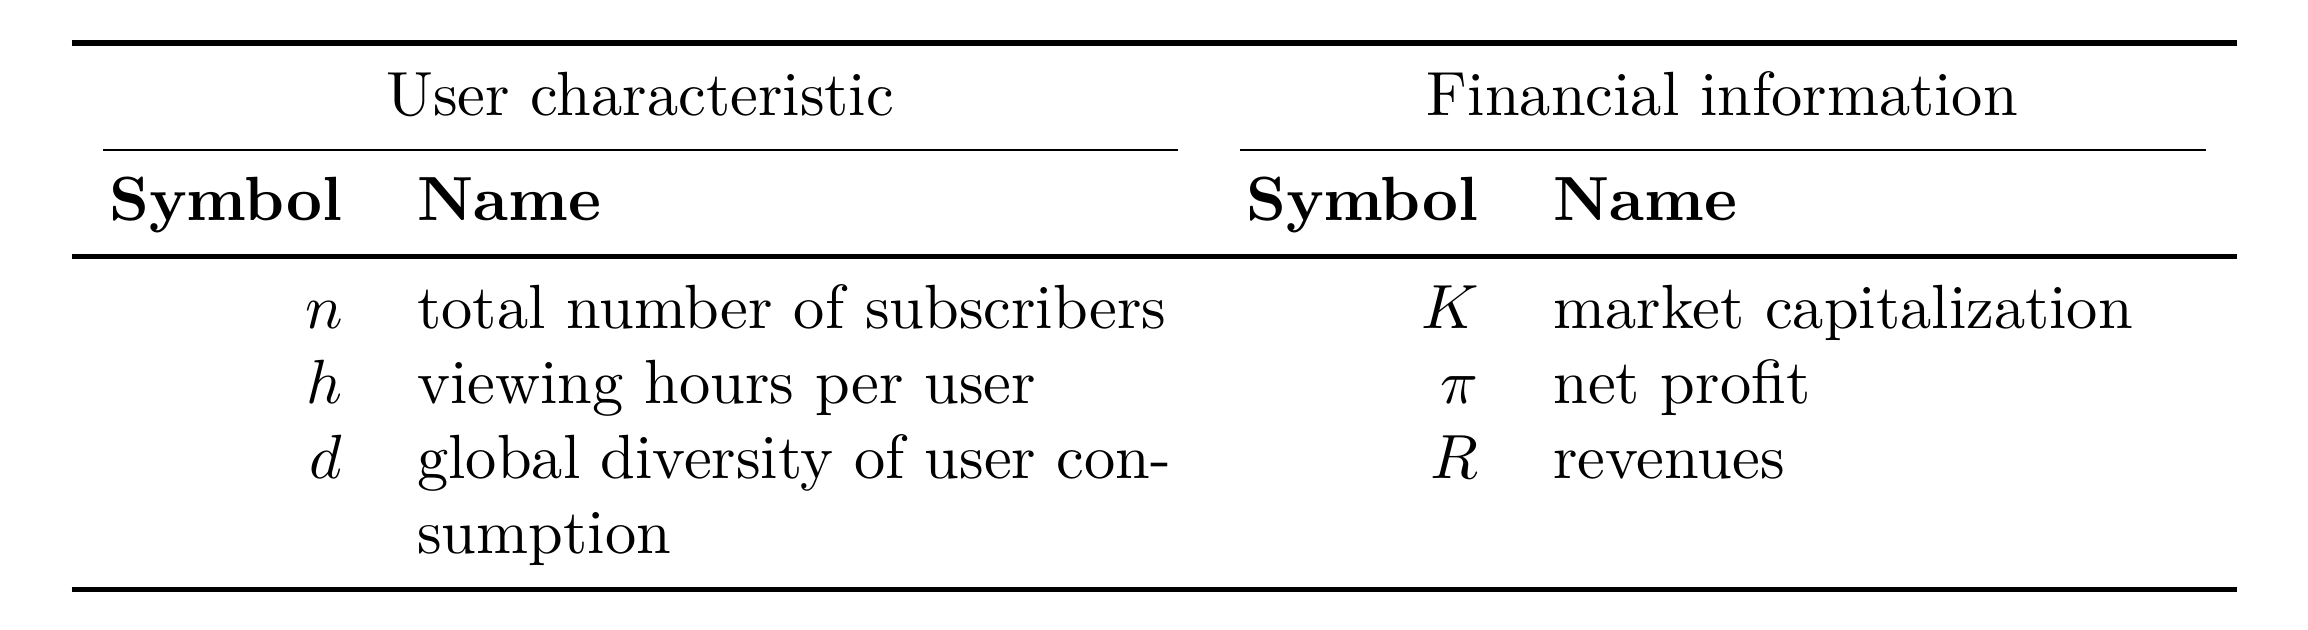
The variables for measuring user characteristics are less self-explanatory than the ones for financial information. Our approach will be to look at each user characteristic, explain the methodology, and produce correlations with each financial variable.
n, the total number of subscribers
This is the easiest user characteristic to measure. In its financial reporting, Netflix has almost always reported on the number of subscribers. Table 2 summarizes the data collection of n.
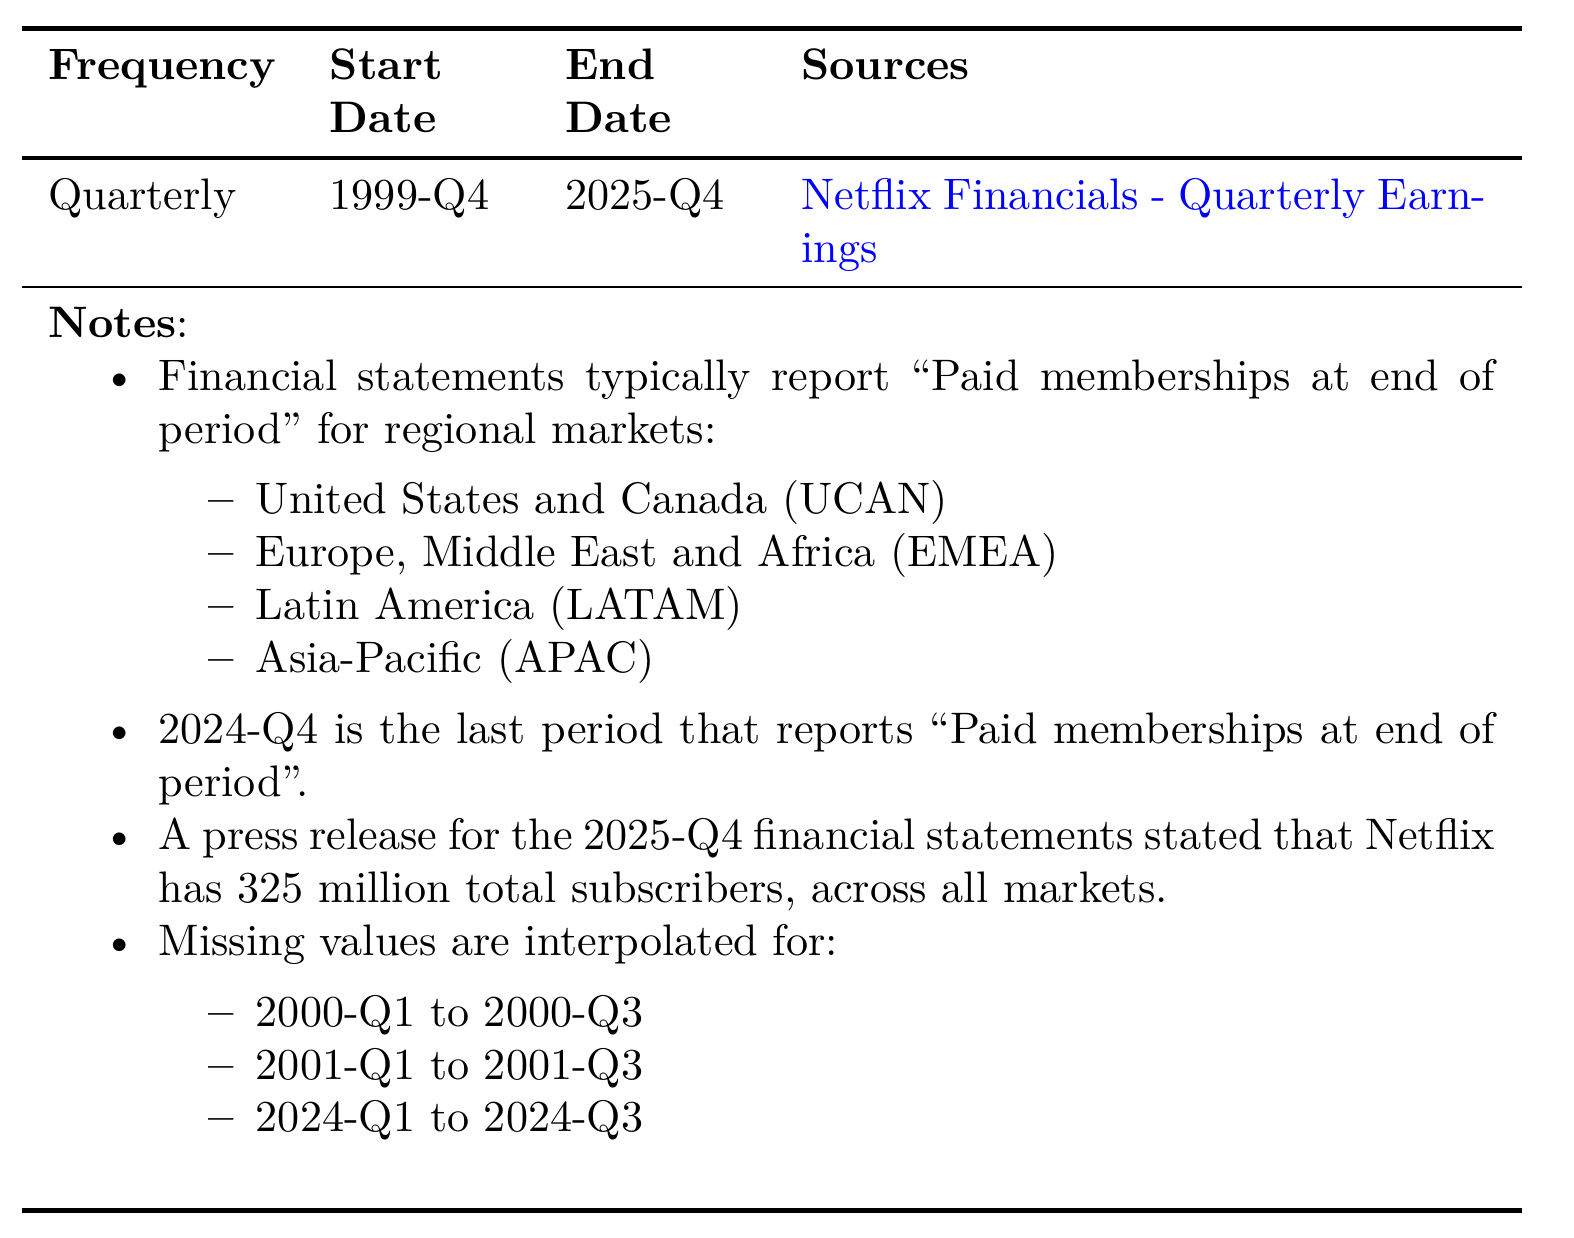
Figure 1 shows the history of Netflix’s subscription growth from 1999 to 2025. Four-quarter subscriber growth between 1999 to 2010 was very fast. In 2000, Netflix’s total number of subscribers was roughly 292 thousand. Netflix reached the 1 million subscriber milestone in 2003 and reached 10 million in 2009. Subscriber growth slowed after 2009, but every four-quarter growth rate between 2010 and 2025 was positive.1 This consistency of positive growth enabled Netflix to achieve 100 million subscribers in 2017 and 300 million in 2024. As of 2025-Q4, Netflix reports to have a global total of 325 million subscribers.
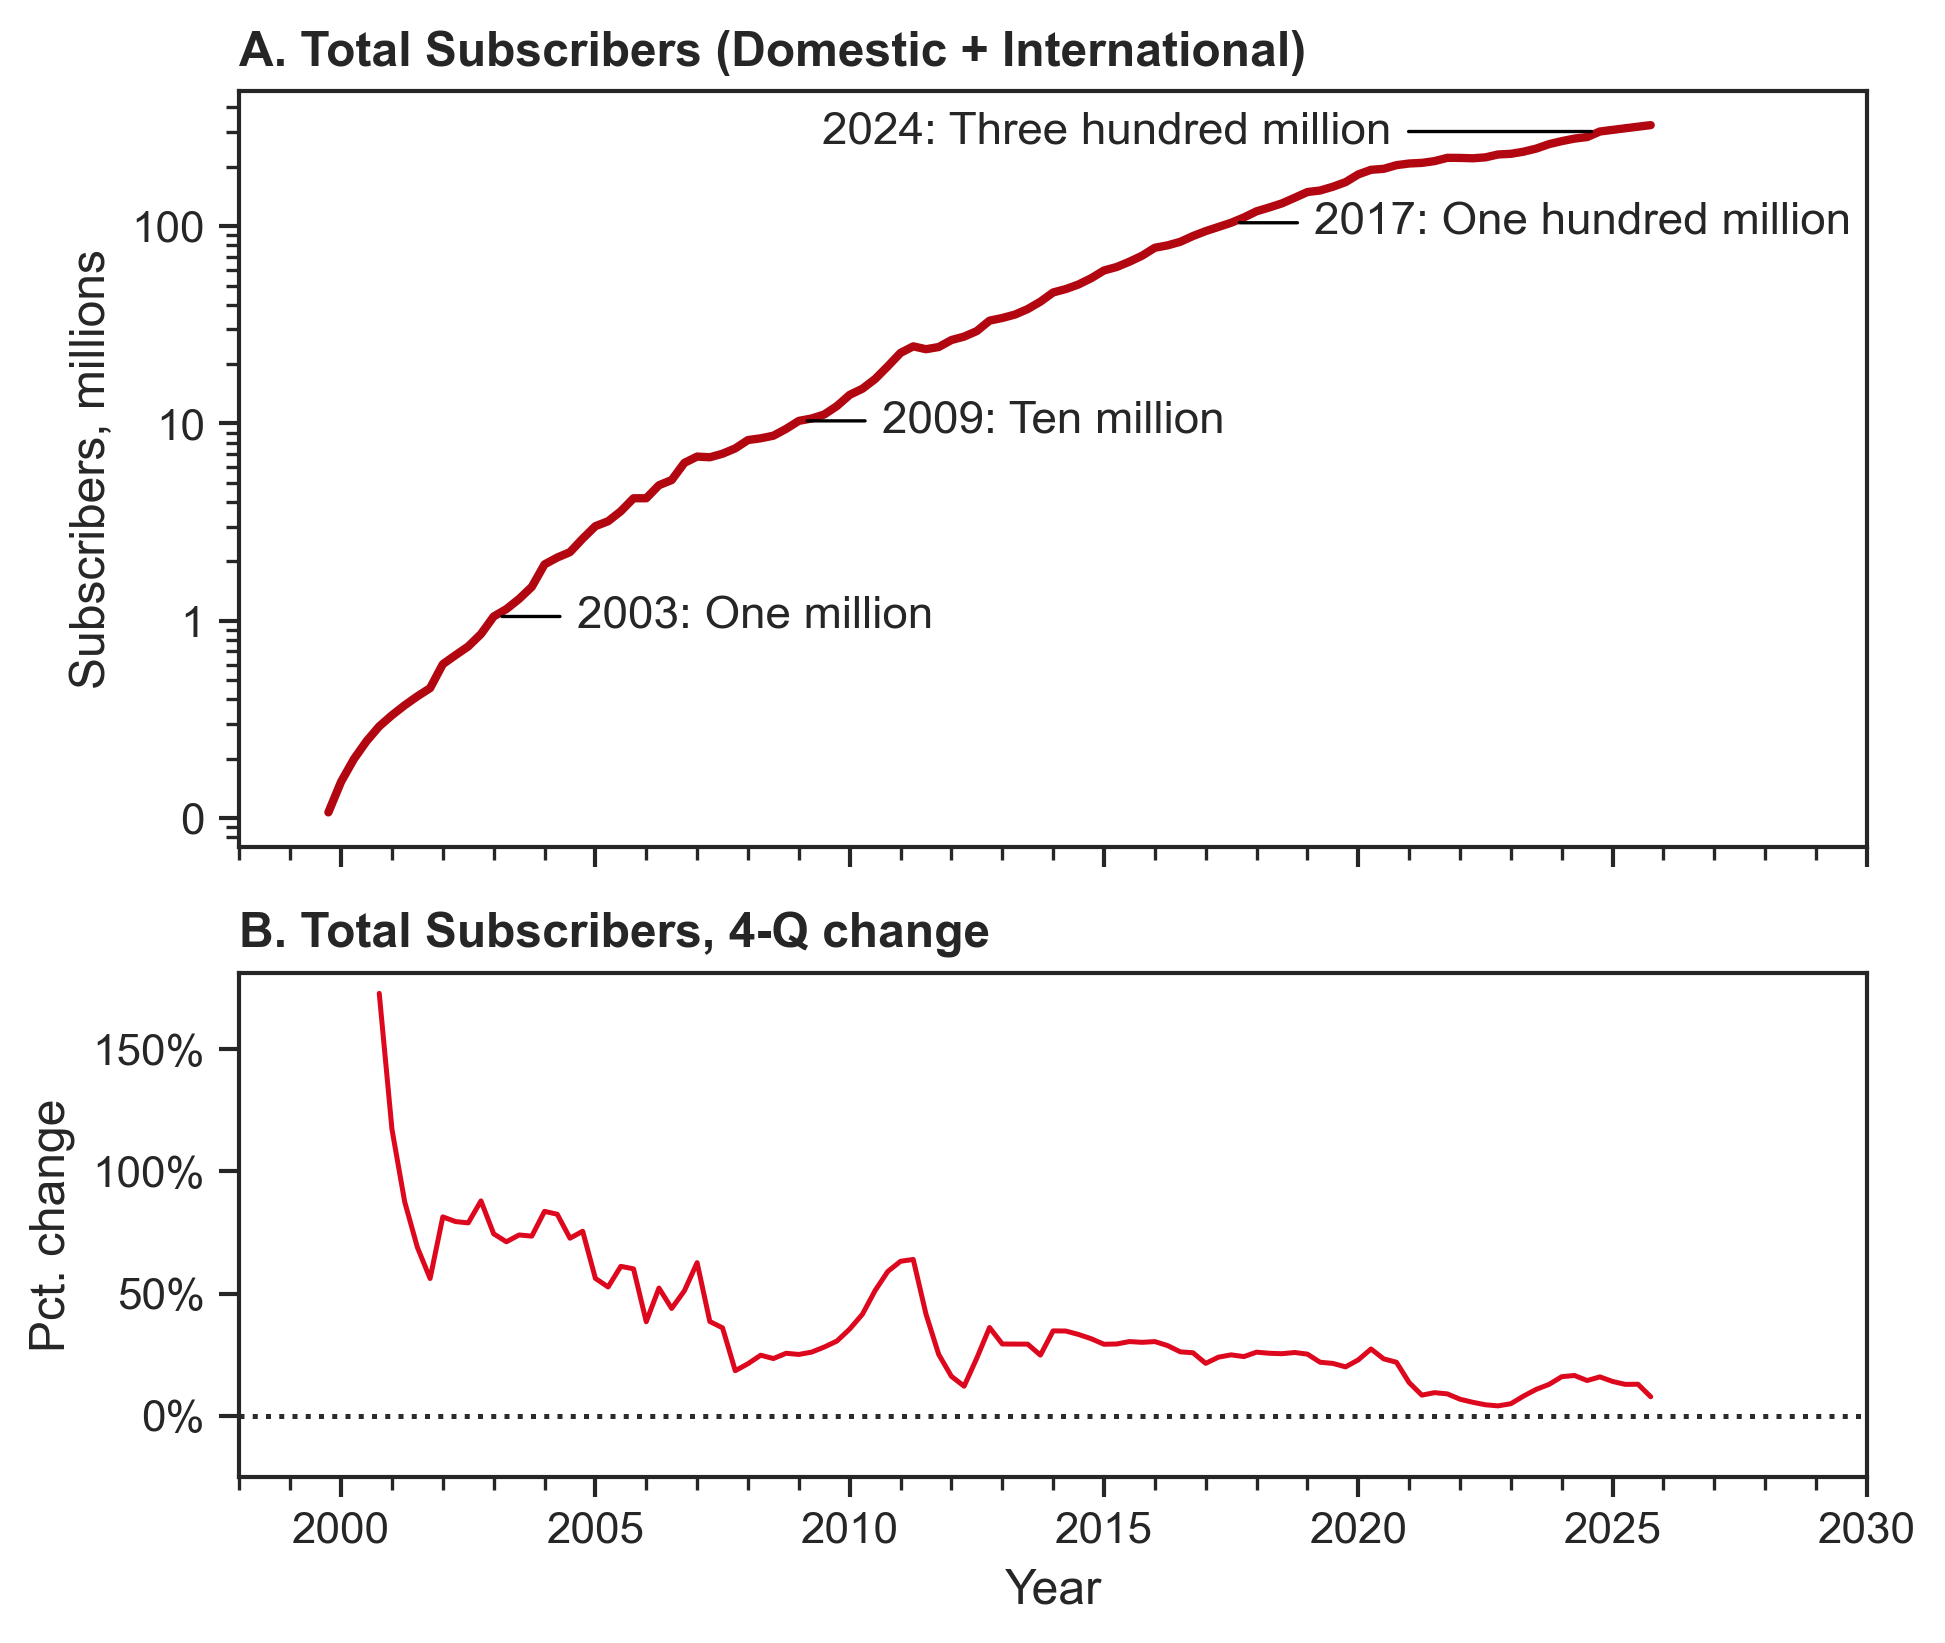
Source: See Table 2.
Figure 2 compares the 4-quarter changes of the number of subscriptions to 4-quarter changes to Netflix’s revenues, net profit, and market capitalization. To the right of each panel is the Pearson correlation of the two series. The correlation between 4-quarter changes to the number of users and 4-quarter changes to revenues is not only the strongest (+0.87), it demonstrates how fundamental user growth is to Netflix’s business. Even when broken down into periods of 5 years, this correlation did not weaken when Netflix attempted to boost revenues with price increases, the introduction of advertisements, and tiered pricing for different video qualities.
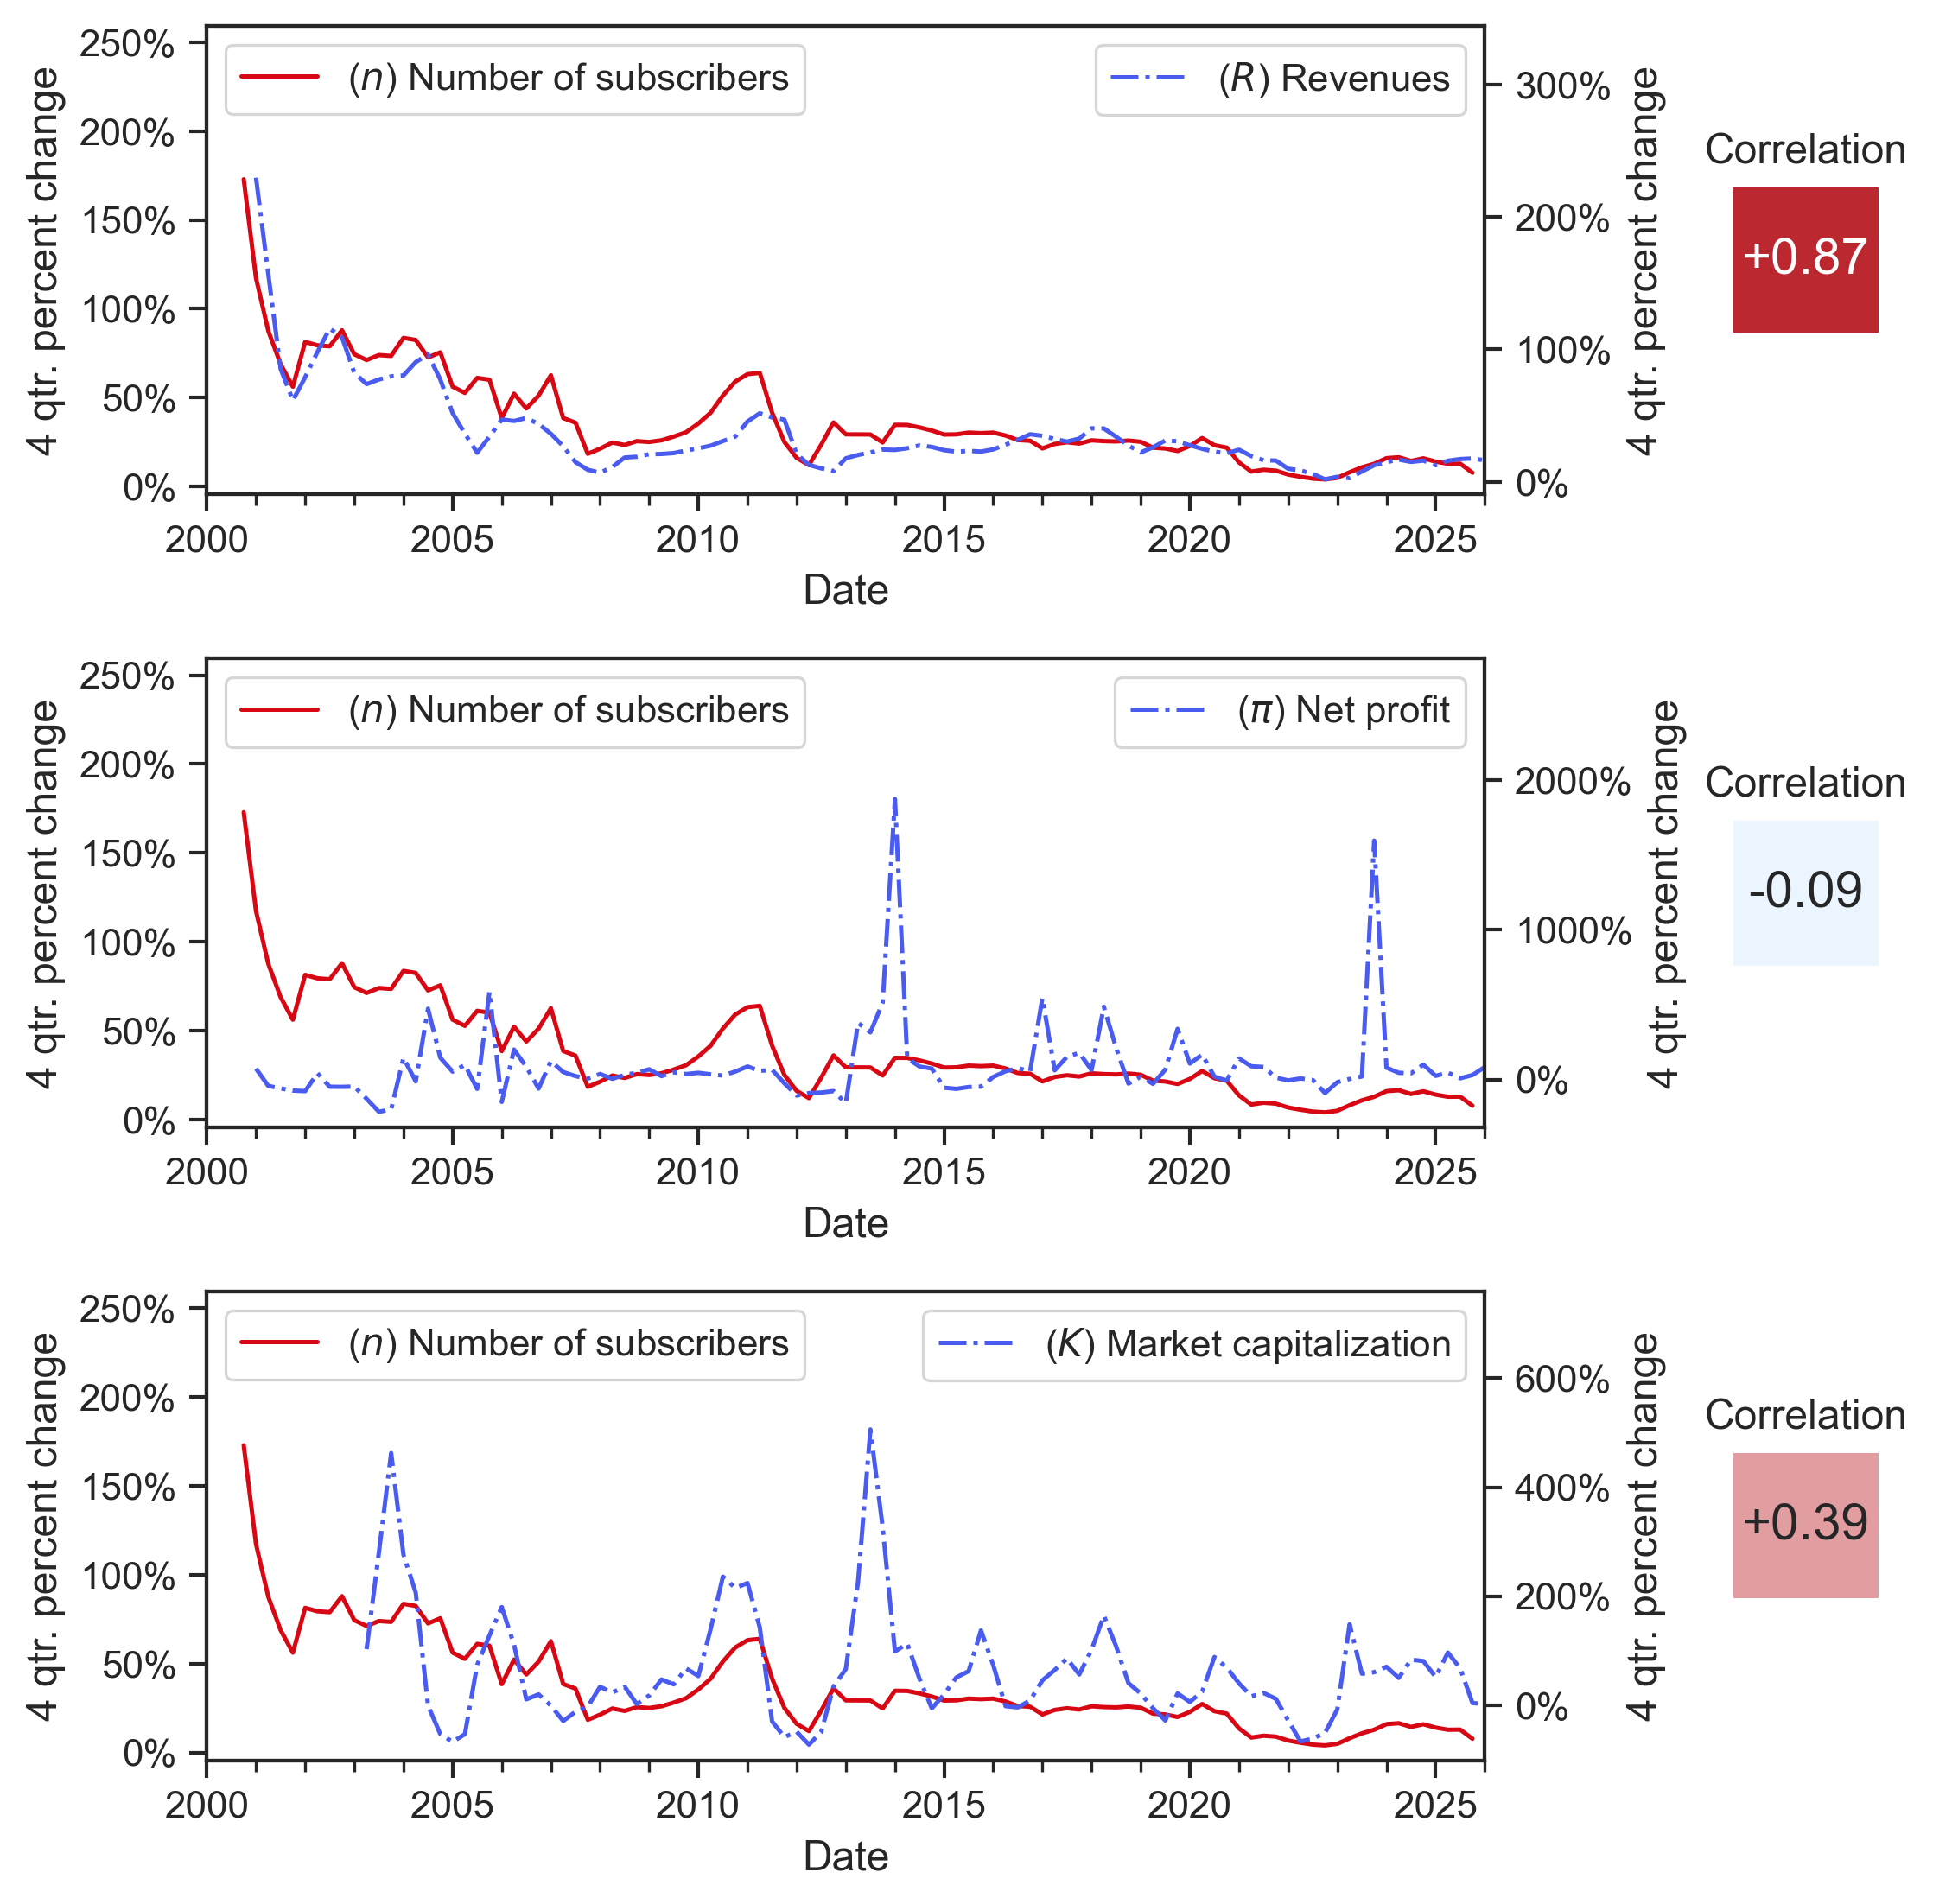
Source: See Table 2 for n, number of subscribers. Compustat for quarterly revenues, net income, and market capitalization of Netflix.
The other two correlations in Figure 2 — corr(n,π) and corr(n,K) — are weaker. There is virtually no correlation between the number of subscribers and Netflix’s net profits. The correlation with market capitalization is positive, but is not as strong as the correlation with revenues. The correlation with market capitalization is a good representation of the whole issue of conceptualizing user experience as being a driver of Netflix’s value. We can see that user growth is hardly irrelevant to Netflix’s market capitalization, but if the market price of Netflix can frequently move independently of user growth, the latter could be getting too much attention in analysis.
But we should also recognize that it could have been possible for market capitalization to correlate strongly with user growth. This possibility exists because capitalization is a social ritual. All capitalization formulas, from the simple to the complicated, are oriented to the future and designed to discount future expectations of income to prices in the present. Written as a financial formula, capitalization is a sleek, scientific-like way to predict the future with the input of variables. Yet, the future can be anything and so can these variables. The freedom that can drive a capitalist to quantify their predictions of the future can also be what produces, in periods of anxiety, social rituals in the use of capitalization. Benchmarks, standards, and other crowd behaviours prevent the infinity of future uncertainty from suffocating capitalization before it is used.
Nitzan and Bichler (2009) find evidence of capitalization’s ritualistic application in the very strong correlation between the price of the S&P 500 — a forward-looking discount of future expectations — and its earnings per share, which are earnings from a past fiscal period. They explain:
The alert reader may contest this correlation as deceptive, on the ground that capitalists discount not the current profits depicted in the chart, but the profits they expect to earn in the future. And that certainly is true, but with a twist. Because they are obsessed with the future, capitalists are commonly described as ‘forward looking’. They (or their strategists) constantly conjure up future events, developments and scenarios, all with an eye to predicting the future flow of profit. …
Now, imagine the uneasy feeling of a capitalist having to walk backwards into the future – not seeing what she is back-stepping into, having no idea when and where she may trip and not knowing how far she can fall. Obviously, she would feel much safer if her waist were tied to a trustworthy anchor – and preferably one that she can see clearly in front of her. And that is precisely what capitalists do: they use current earnings (which they know) as a benchmark to extrapolate future ones (which they do not know) – and then quickly discount their guess back to its ‘present’ value (Nitzan & Bichler, 2009, p.186-187).
We can investigate when user growth becomes an anchor in the rituals of capitalizing Netflix. This investigation is important because, like so many facets of film and television culture, capitalists decide what to include in their estimation of future trends. Similar to when one predicts that a film will not make more than $100 million at the box office with this or that actor, Netflix’s investor can choose to calculate the significance of user growth on expected future earnings.
Figure 3 helps us see historical changes in the correlation between user growth and a change in Netflix’s market capitalization. The figure plots a 20-quarter, or 5-year, rolling correlation between these two variables. For example, the value for 2025-Q4 is +0.71. This is the correlation of n and K for the period from 2021-Q1 to 2025-Q4. Rolling windows show how the strength of the correlation changes. Periods of strong correlations are contrasted by weak periods, like the one from 2016 to 2019. Strong correlations also overlap with the evolution of Netflix’s strategies. For instance, the 5-year rolling correlation was high in the first half of the 2010s. This was around the time when Netflix began expanding into international markets, splitting DVD rentals from streaming operations, and producing original content (de Zilwa, 2024). Uncertainty about the success of these strategies could have helped user growth become a ritualistic benchmark for capitalization — at least until the late 2010s.
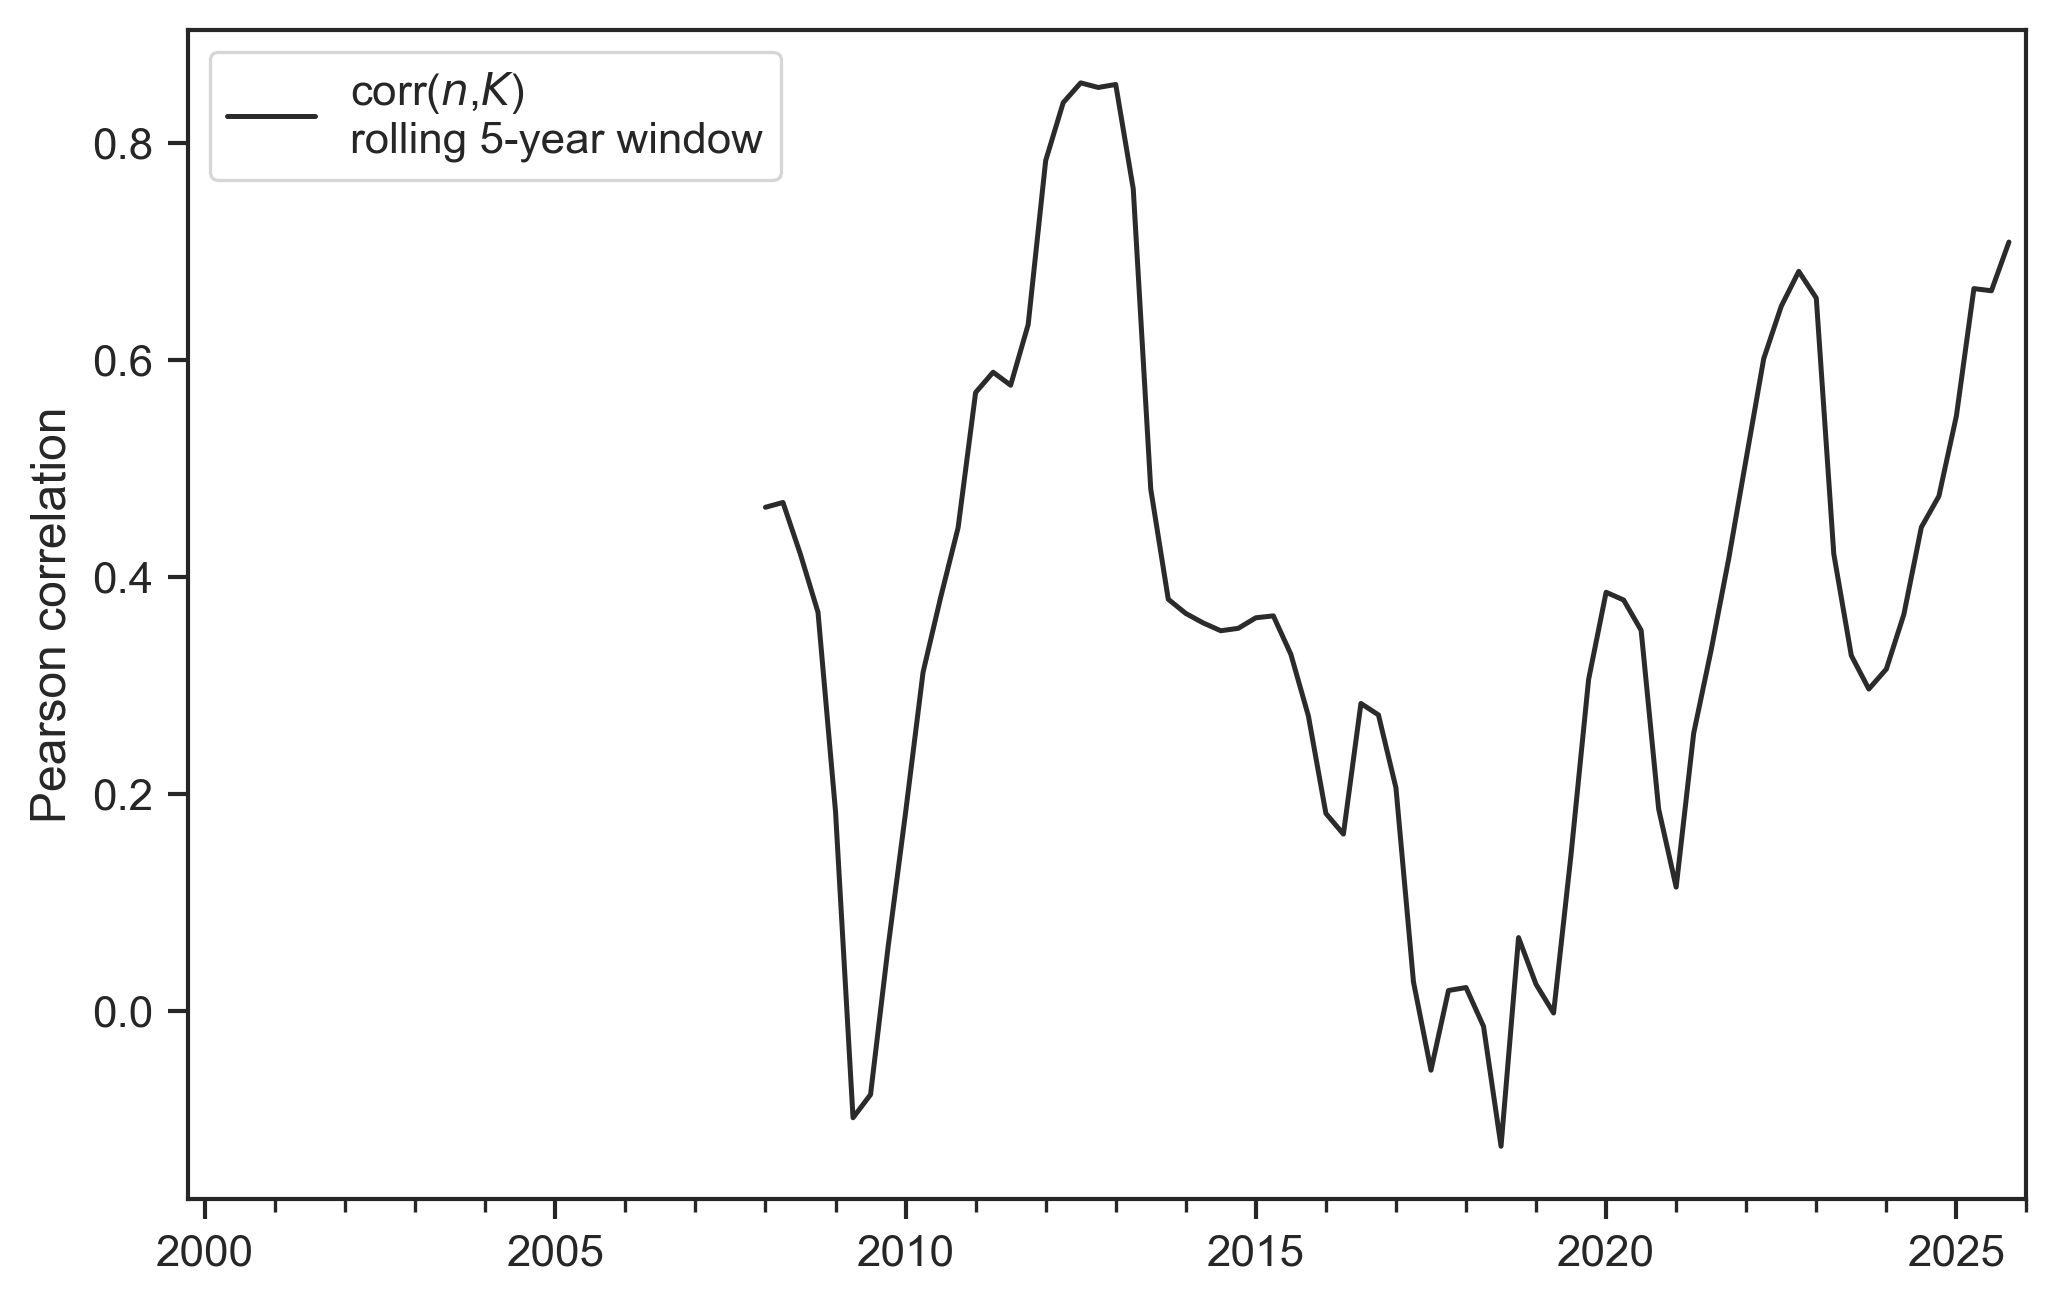
Source: See Table 2 for n, number of subscribers. Compustat for quarterly revenues, net income, and market capitalization of Netflix.
Plenty of things could be happening when the correlation in Figure 3 weakens. Let us consider how a weakening of the correlation is a change in the use of user growth as a benchmark for capitalization. But what would be a symptom of this change? Nitzan and Bichler argued that capitalists grab onto benchmarks to eliminate or contain feelings of uncertainty when predicting future earnings. These feelings of uncertainty can go up and down over time and with changes in capitalism. For example, Nitzan and Bichler found that when capitalists experience periods of high confidence, they untether market capitalization from past profits. In these moments, the capitalist walking backward into the future is fearless and does not need an anchor. Conversely, when capitalist confidence is very low, the reliance on past profits is strong and uncertainty about the ability to discount future expectations transforms into what Nitzan and Bichler call systemic fear (Bichler & Nitzan, 2010).
We can observe changes in capitalist confidence with the I/B/E/S Historical Earnings Estimate Database. Accessible through Wharton Research Data Services, this database
is an historical earnings estimate database containing analyst estimates for more than 20 forecast measures – including EPS (earnings per share), revenue, price targets, EBITDA and pre-tax profits – available on both consensus and detailed levels, covering both U.S. and international companies. The database also includes buy-hold-sell recommendations (Wharton Research Data Services, 2026).
For Netflix’s earnings per share (EPS), one fiscal year in the future, this database has the recorded predictions of 179 analysts. The average of these estimates are labelled as the consensus estimate for a given time period. Since 2009, the consensus estimate for Netflix has been the product of more than 30 analysts.
Figure 4 constructs a method to observe changes in confidence. The red series in Panel A shows the average forecast of Netflix’s EPS, one year into the future. The upward trend of these predictions is not necessarily a sign of rising capitalist confidence. Each prediction is one year into the future, which means that, at any point, there is a most-recently-published statistic of Netflix’s EPS. For example, if I have to predict the year-end EPS of Netflix in 2026, I can see that in 2025 Netflix reported a year-end Basic EPS of $2.58. Therefore, if Netflix’s reported EPS has grown historically — which it has — simple growths in the average prediction are likely to follow.
Increases in capitalist confidence happen when the predictions are higher than usual. Our method uses the 5-year rolling average of consensus estimate of Netflix’s EPS, one year into the future. This series, plotted as a dashed line in Panel A of Figure 4, can be used to show the relative difference between each yearly consensus estimate and the trend of estimates in the last five years. Our index of analyst optimism is plotted in Panel B. When this series is greater than 1, it means that an annual consensus estimate is above the 5-year trend of consensus estimates.2
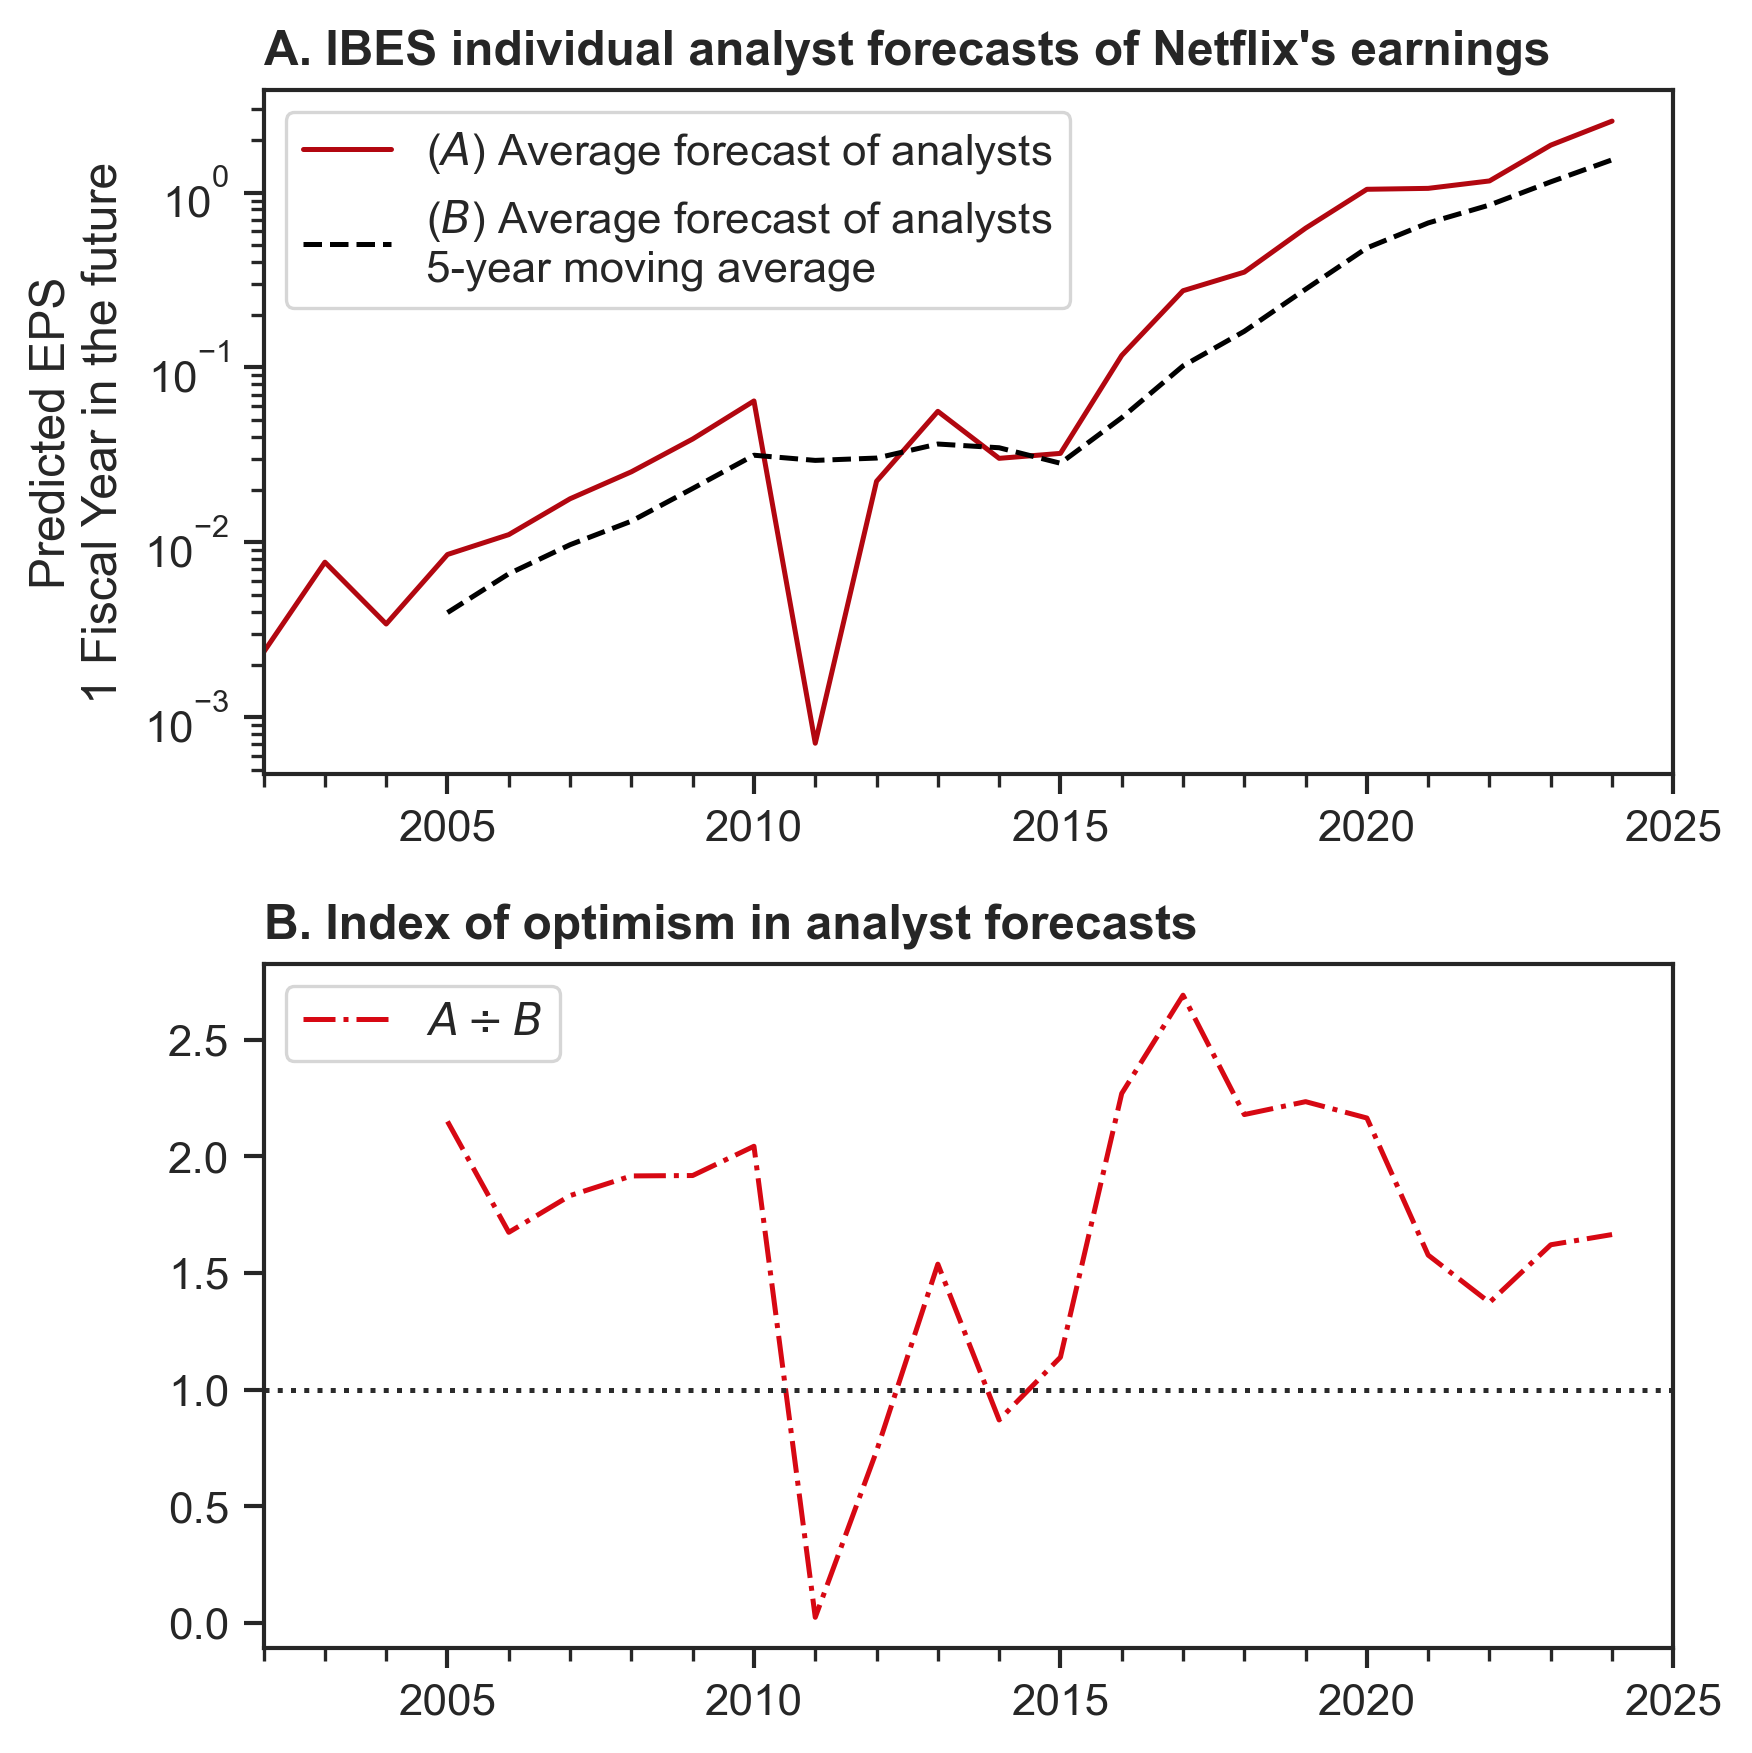
Note: The I/B/E/S Historical Earnings Estimate Database logs its data with several dates. This figure uses the Forecast Period End Date (FPEDATS), which is the date to which the estimate applies. The series is then shifted backwards by the size of the forecast period. For example, a one-fiscal-year estimate of EPS for December 31, 2022 is shifted to December 31, 2021.
Source: I/B/E/S Historical Earnings Estimate Database, via WRDS.
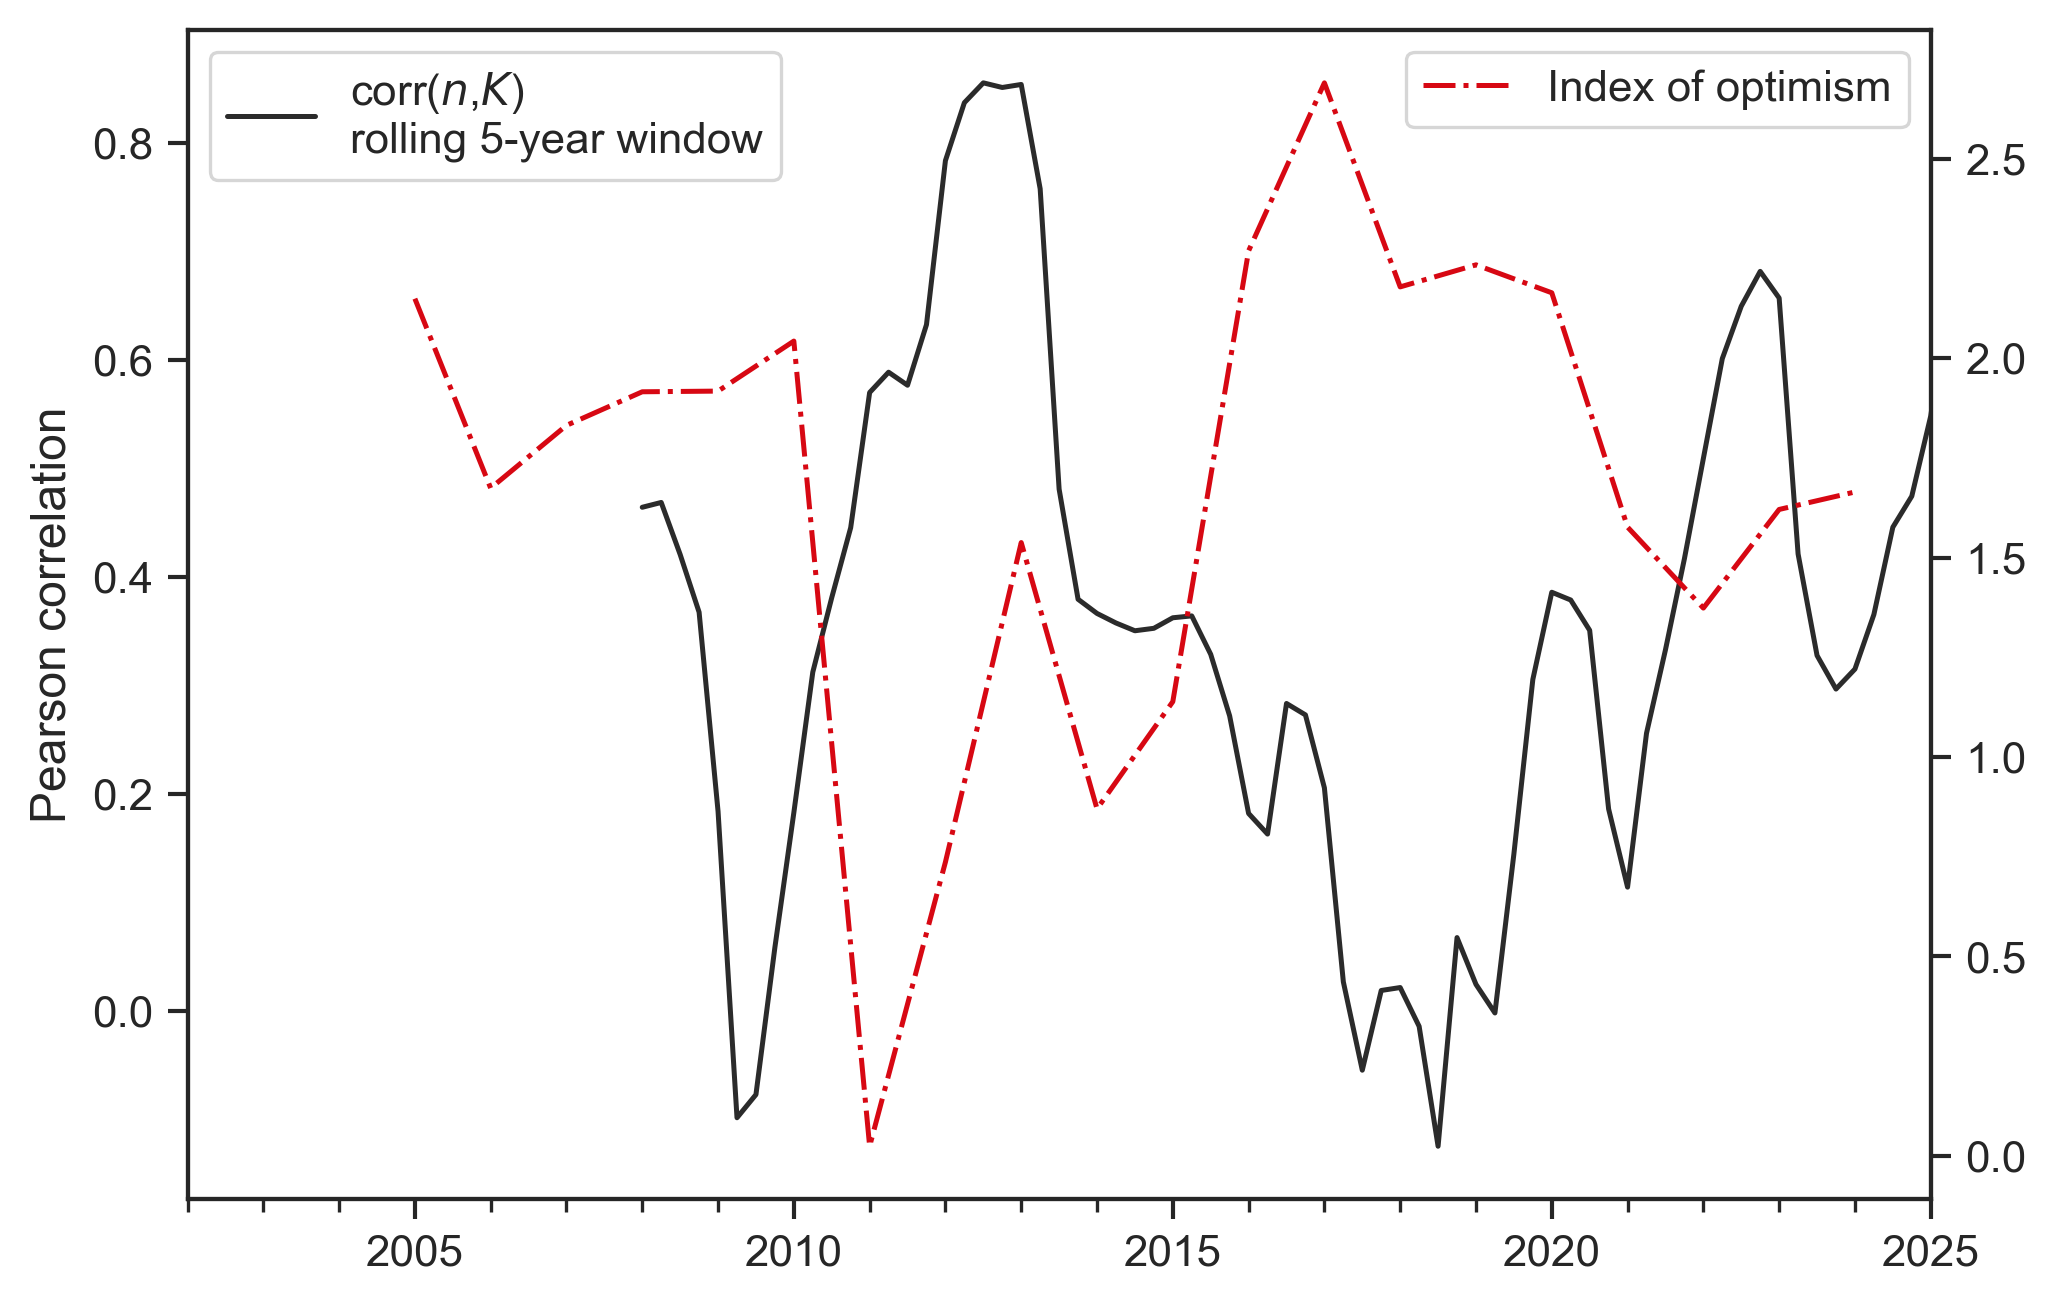
Figure 4 demonstrates that analysts had periods of significant optimism about future earnings of Netflix. In particular, expectations of EPS from 2015 to 2020 would progressively be higher than their 5-year trends. The significance of this optimism is visible when we map Panel B of Figure 4 onto Figure 3. As shown in Figure 5, there is a strong negative correlation between the index of analyst optimism and the rolling correlation between user growth and market capitalization. User growth was the ritual anchor of Netflix’s market capitalization when analysts were pessimistic about future EPS. For example, in the early 2010s, when the correlation between user growth and market capitalization was high, the strategies of Netflix caused analyst expectations to sink, at least in terms of earnings one year into the future.
Footnotes
- Netflix has lost subscribers, but these loses are measured through quarter-over-quarter percent changes — e.g., the change from Q3 2022 to Q4 2002. Netflix experienced quarter-over-quarter loses of subscribers in 2022, and this attracted the attention of journalists, researchers, and analysts (Adalian, 2022; Dedar, 2022; de Zilwa, 2024; Gleiberman, 2022). ↩︎
- These methods are inspired by, but slightly different from, Nitzan and Bichler’s measurements of hype, which is a coefficient that inflates or deflates expected earnings. They measure hype as the ratio between predicted EPS and actual EPS, as reported for the same period. See Chapter 11 of (Nitzan & Bichler, 2009). ↩︎
References
Adalian, J. (2022). The Great Netflix Panic of ’22. Vulture. Retrieved from https://www.vulture.com/2022/01/netflix-panic-of-22.html
Bichler, S., & Nitzan, J. (2010, July). Systemic Fear, Modern Finance, and the Future of Capitalism. Dissident Voice. Retrieved from http://bnarchives.yorku.ca/290/02/20100700_bn_systemic_fear_modern_finance_future_of_capitalism_dv.htm
Crawford, C. J. M. (2021). Netflix’s Speculative Fictions: Financializing Platform Television. Lanham, MD: Lexington Books.
Dedar, S. (2022). 2022 was the year Netflix came down to earth. Collider. Retrieved from https://collider.com/netflix-2022-problems/
de Zilwa, D. K. (2024). Netflix: rise, fall and recovery. Journal of Business Strategy, 45(6), 405-413.
Frey, M. (2021). Netflix Recommends: Algorithms, Film Choice, and the History of Taste. University of California Press.
Gleiberman, O. (2022). Netflix Lost Subscribers, But It really Lost Something Larger – Call It Mythology. Variety. Retrieved from https://variety.com/2022/film/columns/netflix-lost-subscribers-questions-1235255088/
Gomez-Uribe, C. A., & Hunt, N. (2015). The Netflix Recommender System: Algorithms, Business Value, and Innovation. ACM Transactions on Management Information Systems, 6(4), 1-19.
Nitzan, J., & Bichler, S. (2009). Capital as Power: A Study of Order and Creorder. New York: Routledge.
Pajkovic, N. (2022). Algorithms and taste-making: Exposing the Netflix Recommender’s System’s operational logics. Convergence: The International Journal of Research into New Media Technologies, 28(1), 214-235.
Wharton Research Data Services. (2026). WRDS Overview of IBES.


One thought on “Examining user value in the economics of Netflix: the number of subscribers”