

This post extends from the first post about user value in the economics of Netflix. If you came to this post without reading the other one first, here is a snippet of what will be measured in a series of posts:
Our empirical investigation will test combinations of relationships between Netflix’s users and the firm’s financial performance. These tests will not only help us gauge the strength of these relationships. They also demonstrate that the availability of data matters. Imagining the ways user experience is good for Netflix’s financials is one thing; it is another thing for researchers, analysts, shareholders, and a curious public to actually have data to test theories of user experiences on the Netflix platform.
Table 1 catalogues the variables that measure user characteristics and those that measure financial performance.
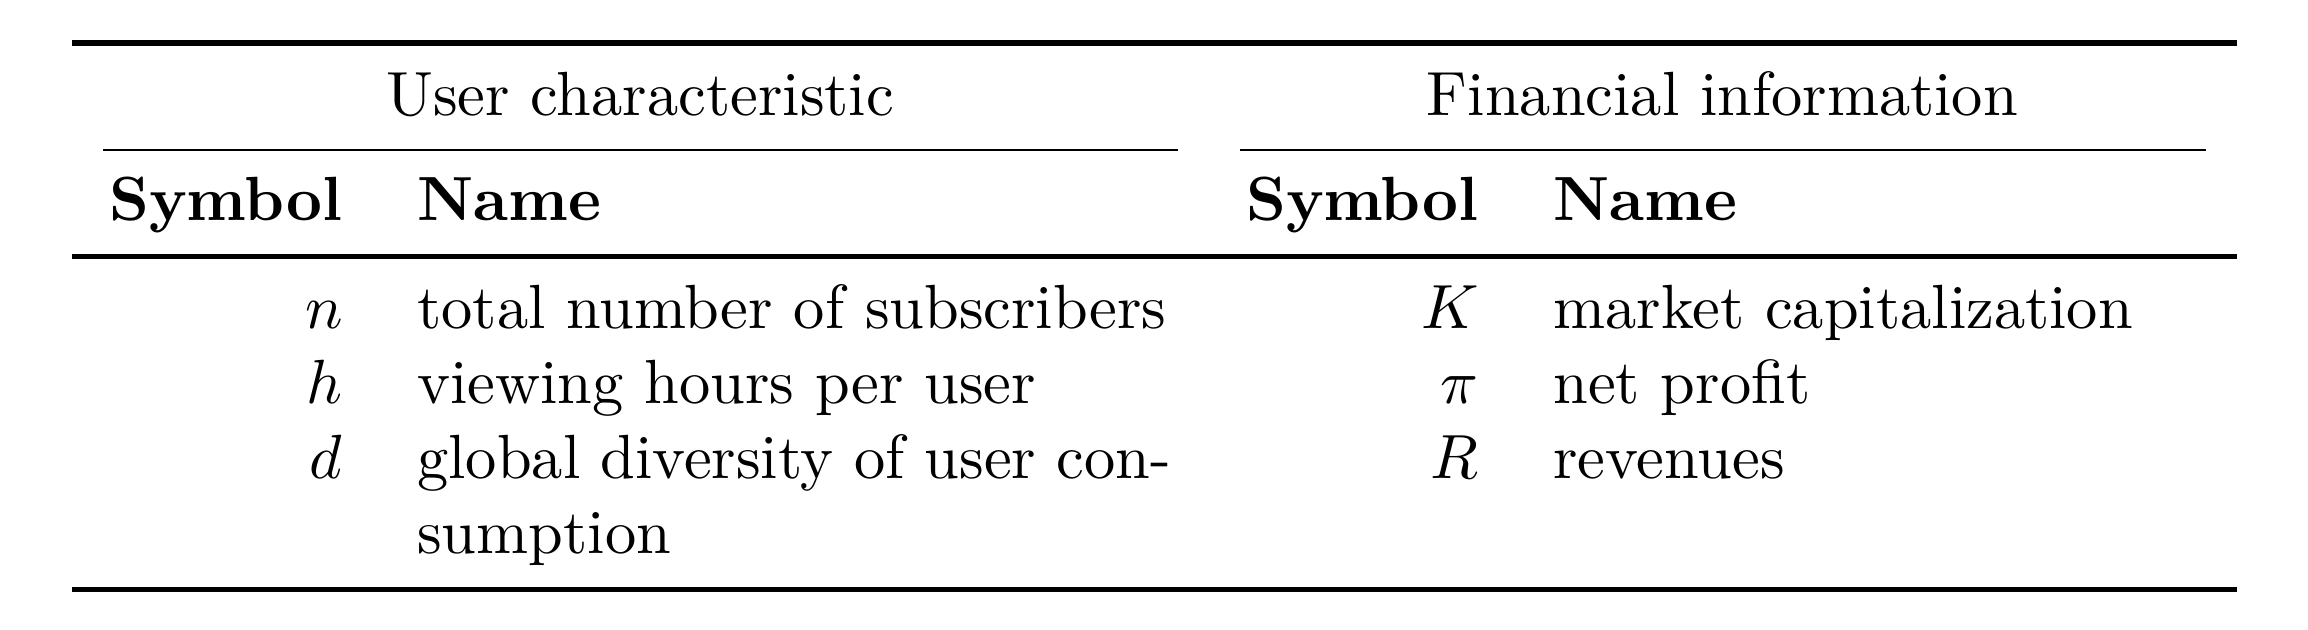
The variables for measuring user characteristics are less self-explanatory than the ones for financial information. Our approach will be to look at each user characteristic, explain the methodology, and produce correlations with each financial variable.
***
The number of hours someone spends on Netflix seems to be a clear-cut measure of user experience. However, this measure proves to be incapable of explaining why people spend so much or so little time on the platform. It is important to recognize this barrier early. Empirical measurement of usage is, at best, an indirect measure of economic utility, and this means it reproduces the circular logic that Joan Robinson argued was at the core of neo-classical economics:
Utility is a metaphysical concept of impregnable circularity; utility is the quality in commodities that makes individuals want to buy them, and the fact that individuals want to buy commodities shows that they have utility (Robinson, 2017, p. 47).
In the case of Netflix’s purported utility, the circularity works this way: subscribers must find the platform and its content useful because they are paying to spend so much time on it.
There are also empirical reasons to reject a utility theory of viewing hours. As we will see, the usage per Netflix subscriber has declined over time, and this decline correlates with increases in financial performance, including market capitalization. To fit this empirical evidence, an economic theory of utility has a lot of work to do. It would need to demonstrate that — assuming Netflix’s financial magnitudes are nominal representations of real utils — the average Netflix subscriber has gained utility as their time spent watching Netflix has declined.
The measurement and analysis of time spent on Netflix are impacted by limitations in data. The variable of concern is viewing hours per subscriber, which will be denoted as h. Two versions of the variable will be produced from two sources:
- h1 is produced from “What We Watched” tables. These tables report, with minimal exceptions, the total hours of every film and television show that was watched in a six-month period. These tables are released semi-annually.
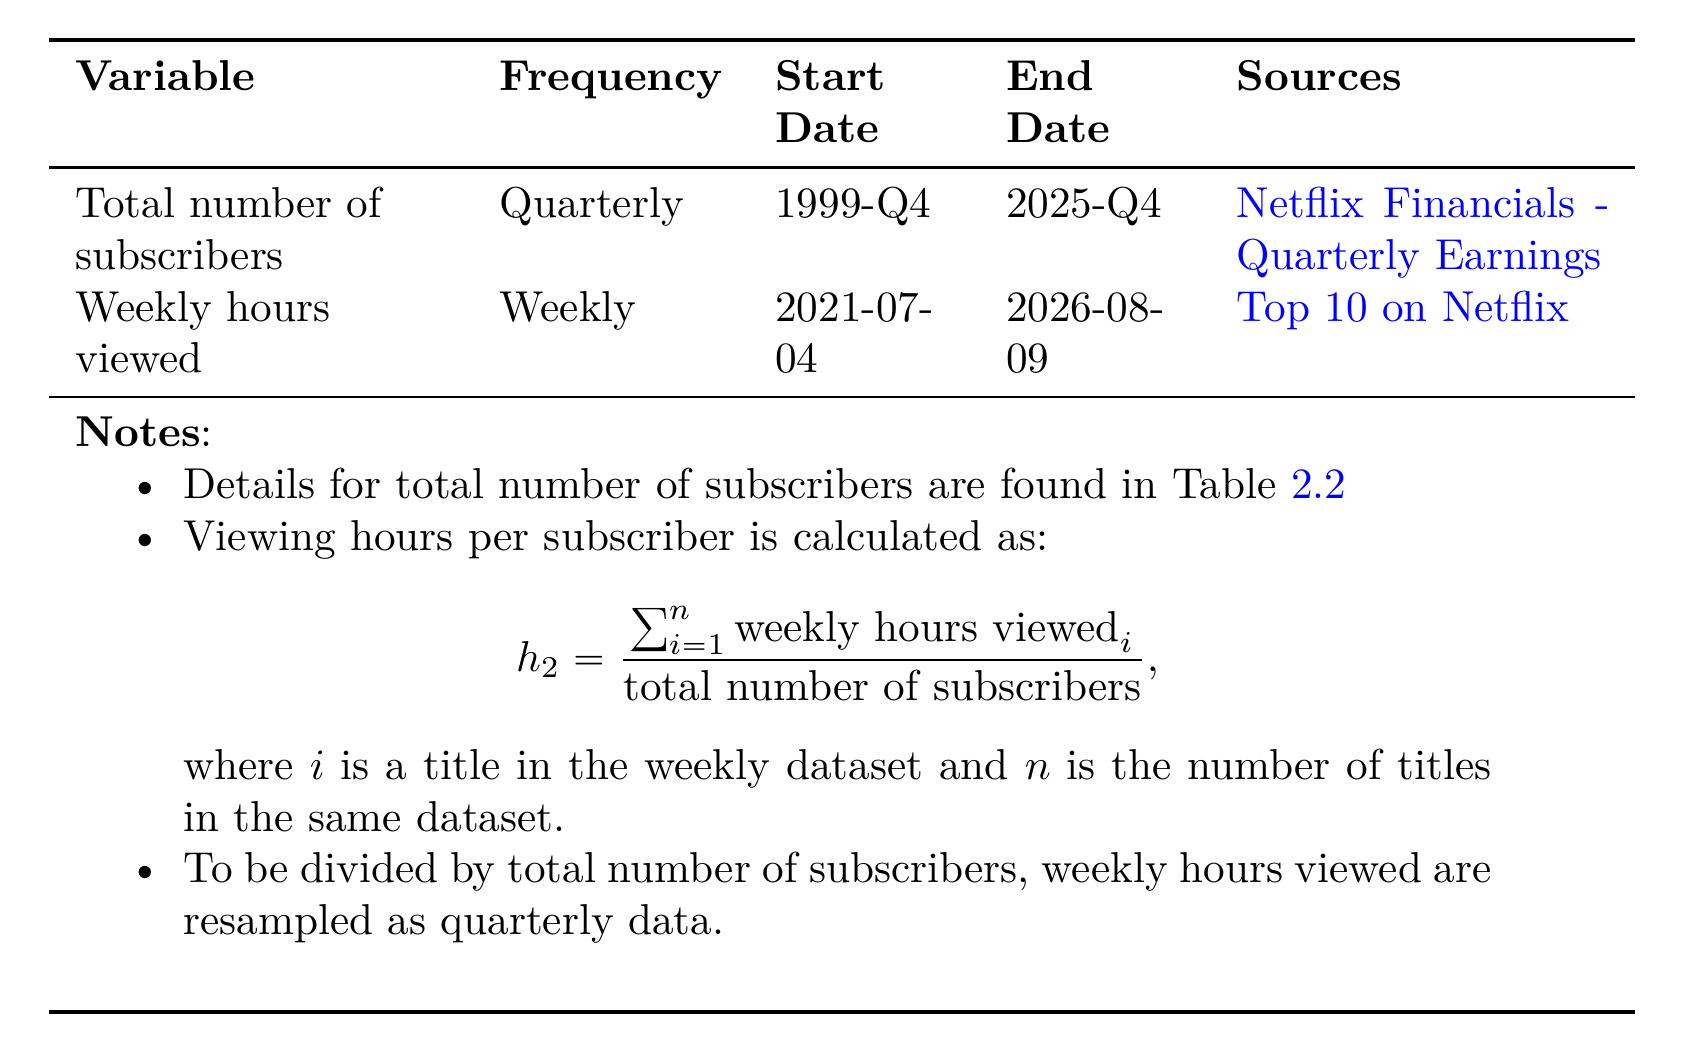
- h2 is produced from weekly reports of the top films and television shows. These reports cover the viewing hours of the ten most watched titles in four categories:
- Film (English)
- Film (Non-English)
- TV (English)
- TV (Non-English)
Ideally, it would be unnecessary to collect and analyse two versions of viewing hours per subscriber. However, each version of h has a limitation. The “What We Watched” reports only began in 2023. We also have to resample its semi-annual data as quarterly data with the simple division of each semi-annual value into two quarters. It is beneficial that the top ten reports began in 2021, but forty titles per week is a tiny share of the number of titles available on Netflix. And while the accumulated hours of the most popular titles in a week are very large, it is reasonable to want to have weekly data about the ways subscribers rewatch their favourite shows or films.
We will examine h1 and h2 in order. The second version of h will be given preference when the correlations with financial performance are summarized.
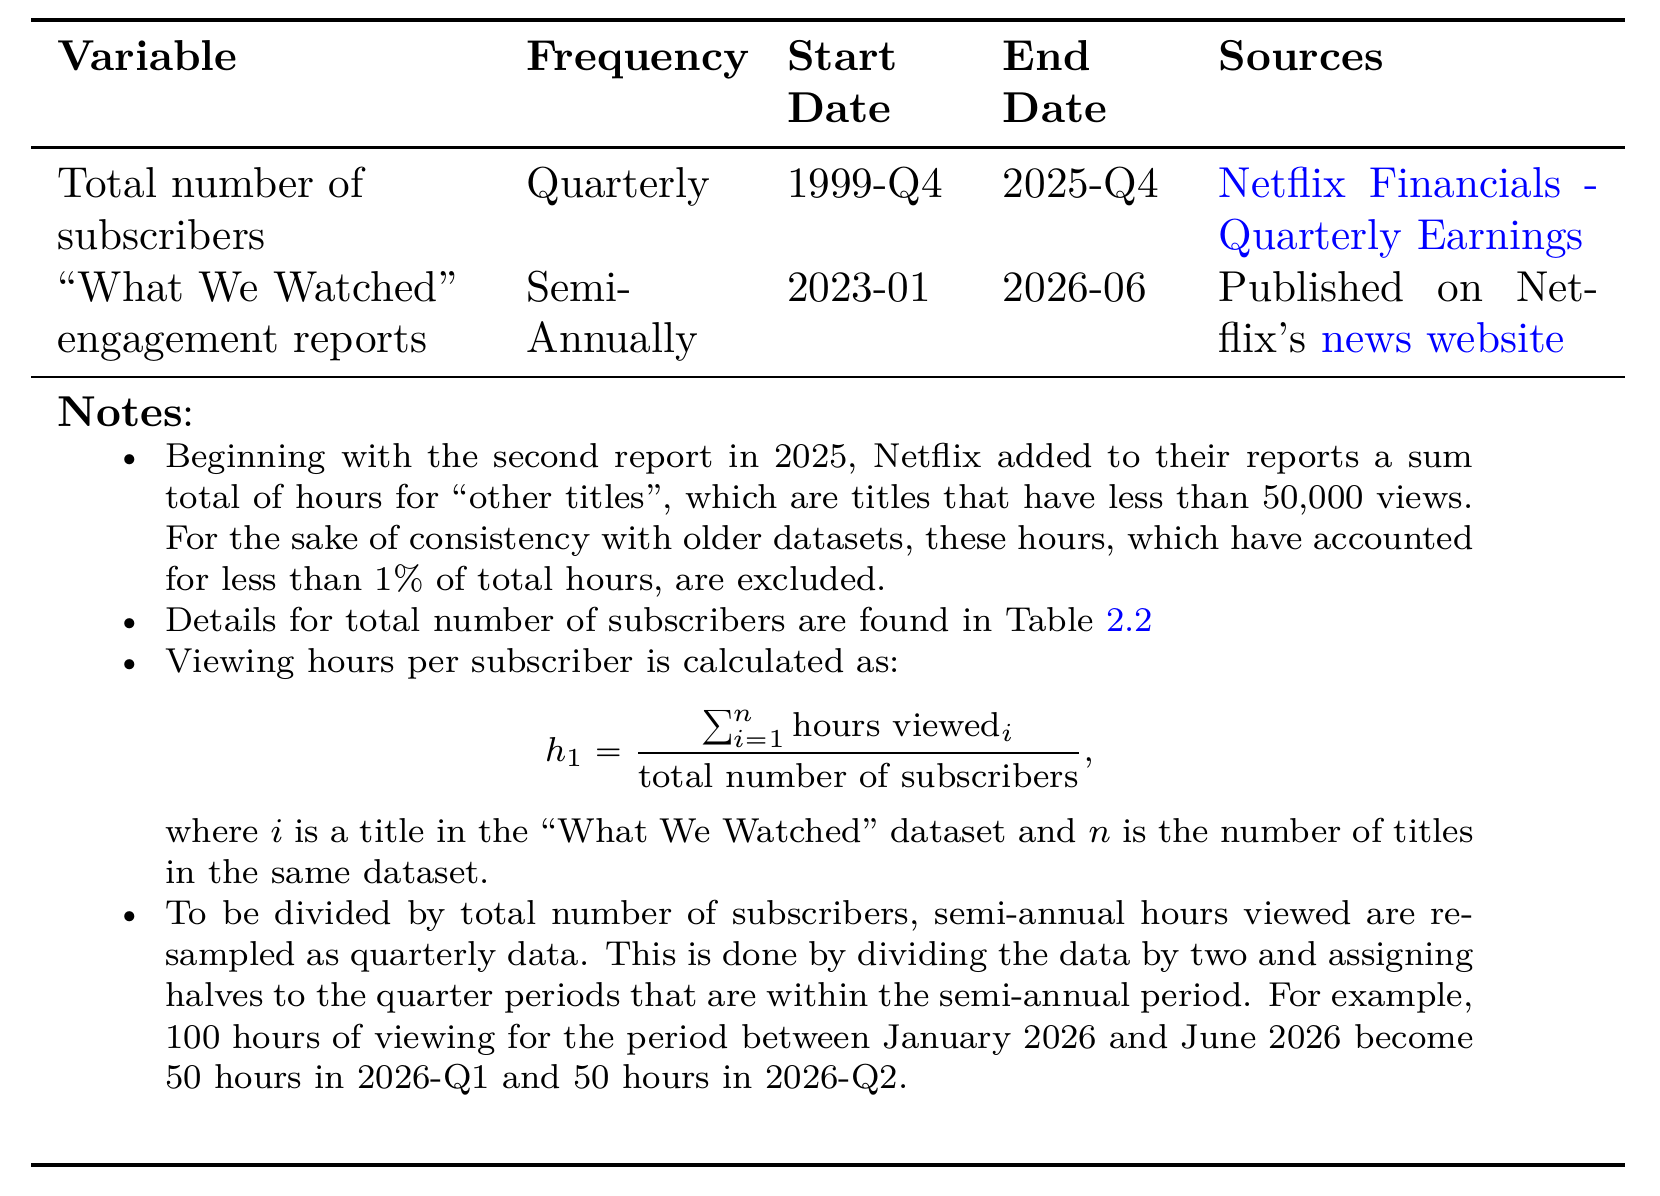
The sources and methods to measure h1 are detailed in Table 1. Figure 1 visualizes the construction of h1. In Panel A we see that total viewing hours, with the exception of the second half of 2023, have increased from 2023 to June 2026. This fact is repeatedly celebrated on Netflix’s webpages that announce the “What We Watched” reports. Yet, total viewing hours have increased with increases in total subscribers, and the increase in the total number of subscribers outpaced the growth of total viewing hours. This trend has caused viewing hours per subscriber (h1) to decline. In 2023-Q1 it is estimated that the average subscriber was watching Netflix 200 hours per quarter, which is roughly 23 hours and 20 minutes per week, or 3 hours and 20 minutes per day. By 2025-Q4, average viewing habits declined 27% to roughly 146 hours and 50 minutes per quarter, just over 17 hours per week, or 2 hours and 26 minutes per day.
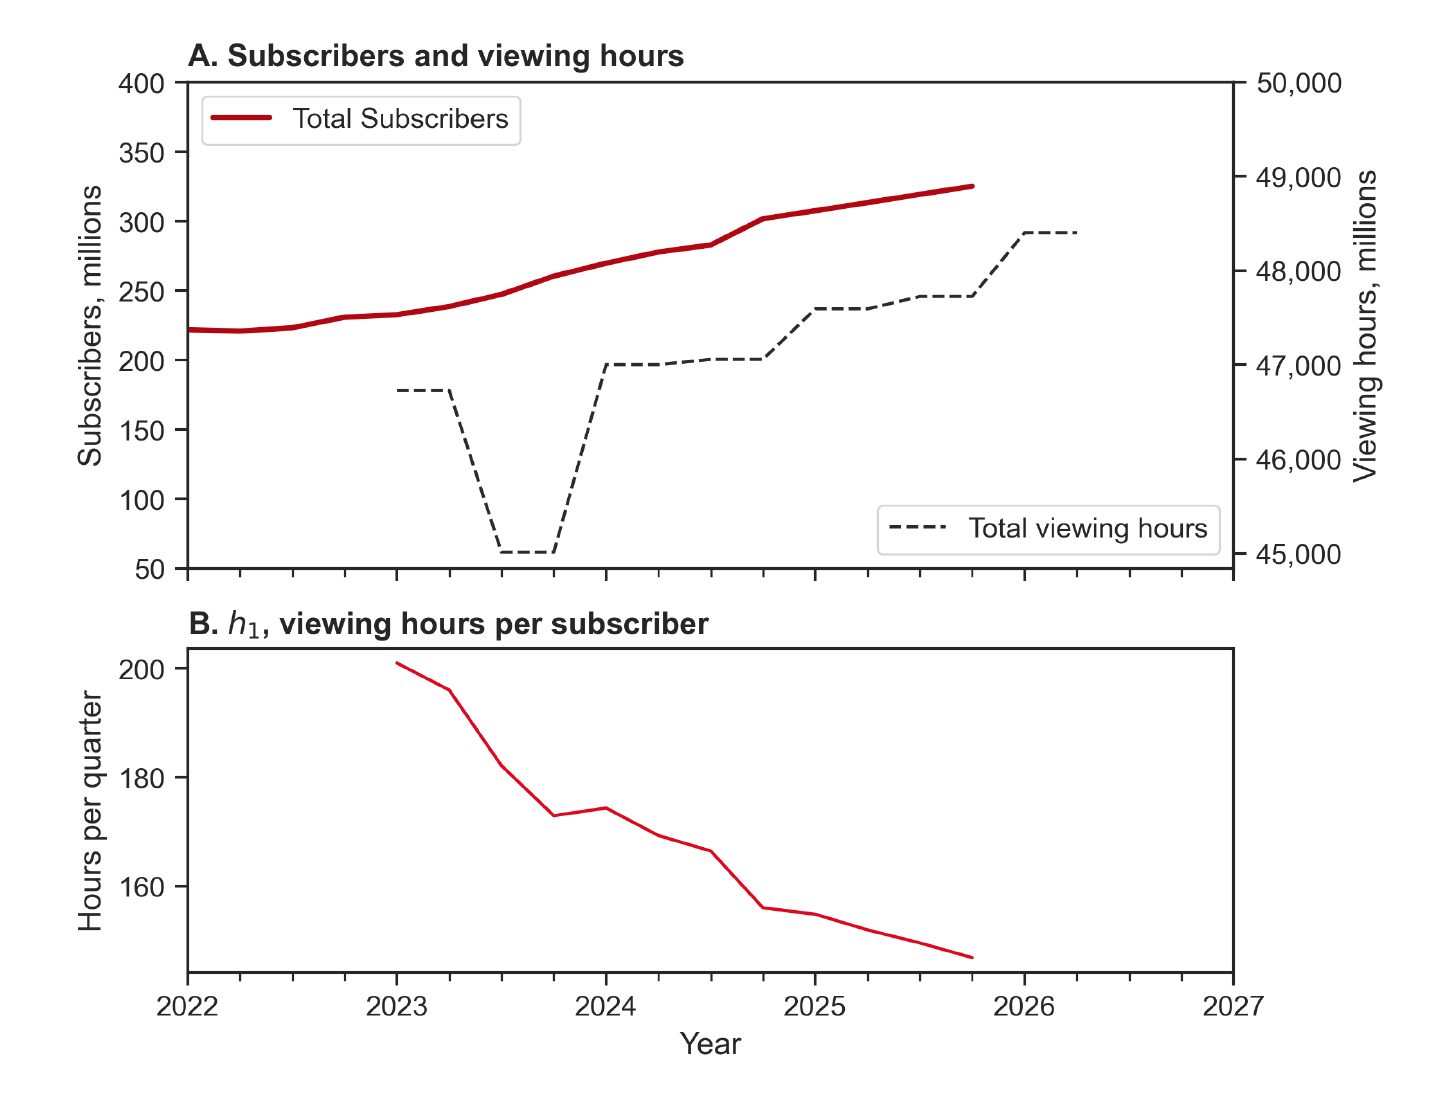
Source: See Table 1.
Figure 2 shows the correlations of h1 with the three measures of financial performance. While I believe that the results of h1 are overshadowed by the results of h2, as the measurements of the latter start two years earlier, the correlations of financial results with h1 should already raise our scepticism with a theory of economic utility. Version one of viewing hours per subscriber has a strong negative correlation with 4-quarter changes of Netflix’s revenues. This makes mathematical sense. The total number of subscribers is in both the denominator of h1 and is a multiplying factor in the main source of Netflix’s revenues (subscription price multiplied by the total number of subscribers). Thus, if other variables stay the same, an increase in the total number of subscribers will depress h1 and inflate Netflix’s revenues.
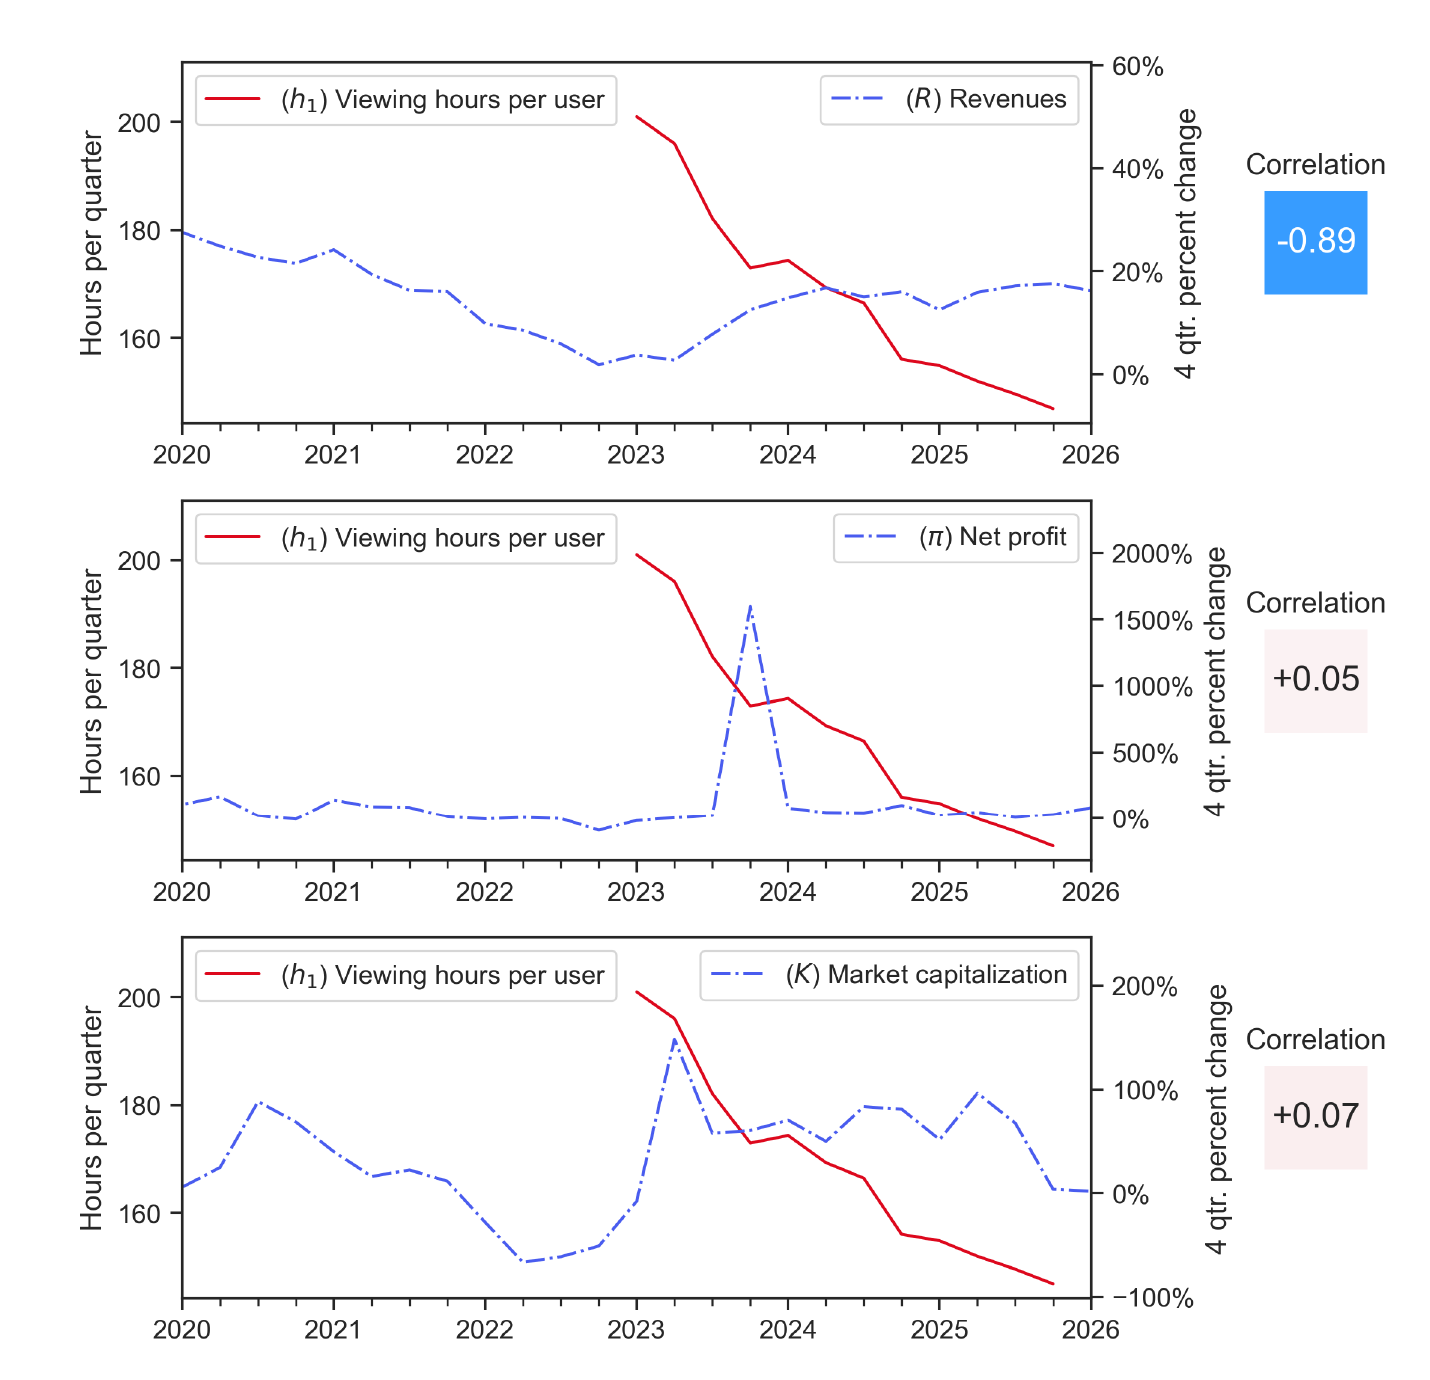
Source: See Table 1. Compustat for quarterly revenues, net income, and market capitalization of Netflix.
However, the economic meaning of the negative correlation is much less straightforward. The growth of Netflix’s subscribers has not raised the average hours viewed per subscriber. In other words, the newest subscriber to Netflix has been, for last few years, unlikely to spend more time on the platform than subscribers that are already there. Just as importantly, new or long-standing subscribers who spend less time on Netflix are not unsubscribing — or at least not in big enough numbers to raise the hours viewed per subscriber. (For example, if three subscribers respectively watch 10, 8 and 0.25 hours of Netflix a week, and the one who barely watches unsubscribes, the average hours per subscriber jumps from 6.17 hours per week to 9 hours per week.) Thus, if the negative correlation between viewed hours per subscriber and revenues is a reflection of economic utility, the recent history of Netflix is somehow a story of a fixed unit of time on Netflix — e.g, one hour — having more hedonic value per subscriber.
Stripped of the metaphysics of economic utility, the trend of declining viewing hours per subscriber is still a curiosity. To offer an alternative explanation that considers the structure of free time, we can move on to the analysis of h2.
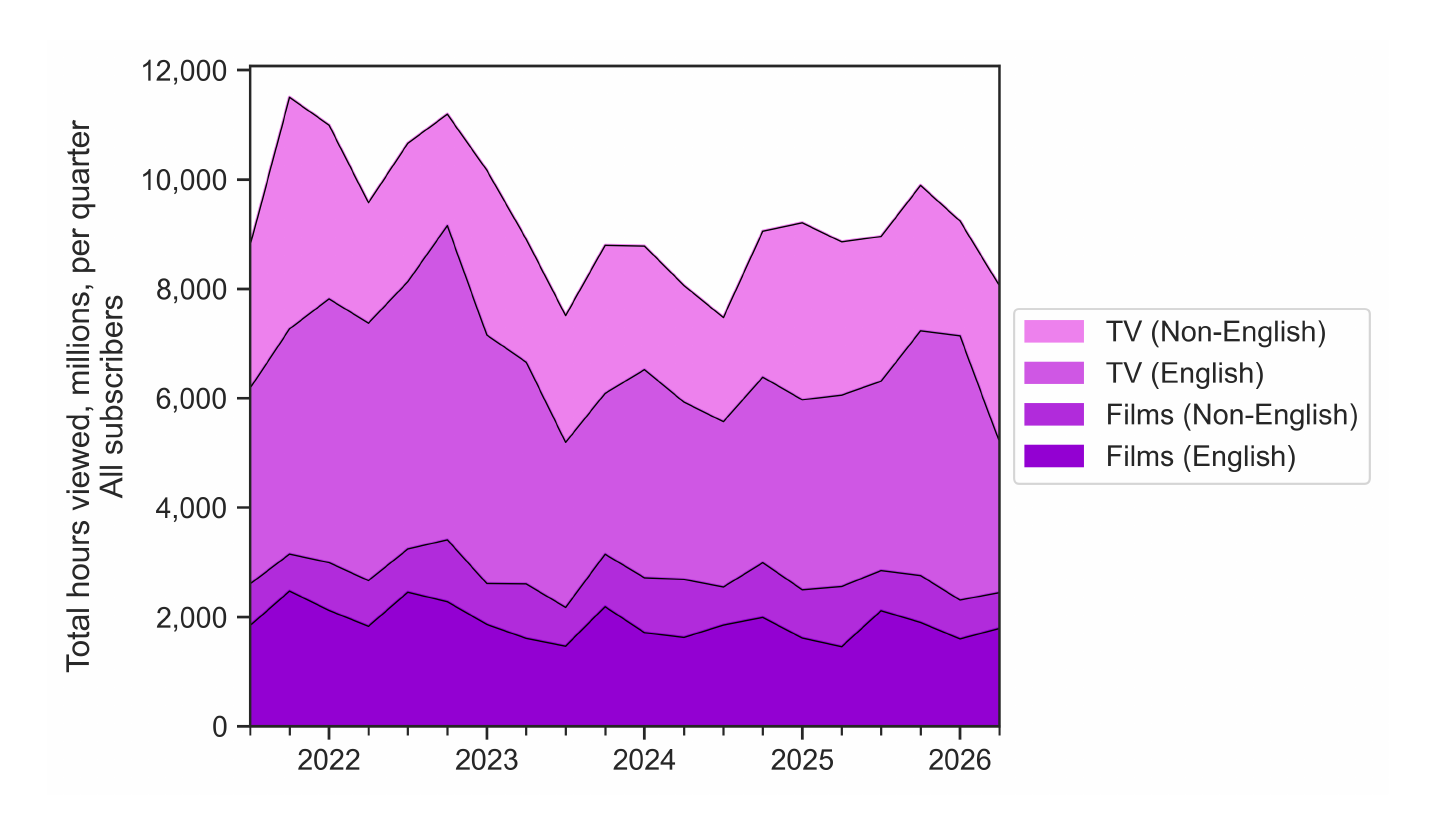
The sources and methods to measure the second version of viewing hours per subscriber are detailed in Table 2. This measurement goes further into the past than h1, but it is also limited by the number of titles in its measurement. As shown in Figure 3, the viewing hours of titles in the four top 10 lists have summed to billions of hours per quarter. Moreover, any title that is not in a week’s top 10 will have viewing hours below the 10th most viewed title of its category — this is true by definition. For the collection of top ten lists from 2021 to 2026, the average weekly viewing hours for 10th place titles are:
- Film (English): 5.66 million hours
- Film (Non-English): 2.18 million hours
- TV (English): 11.16 million hours
- TV (Non-English): 8.19 million hours
Source: See Table 2.
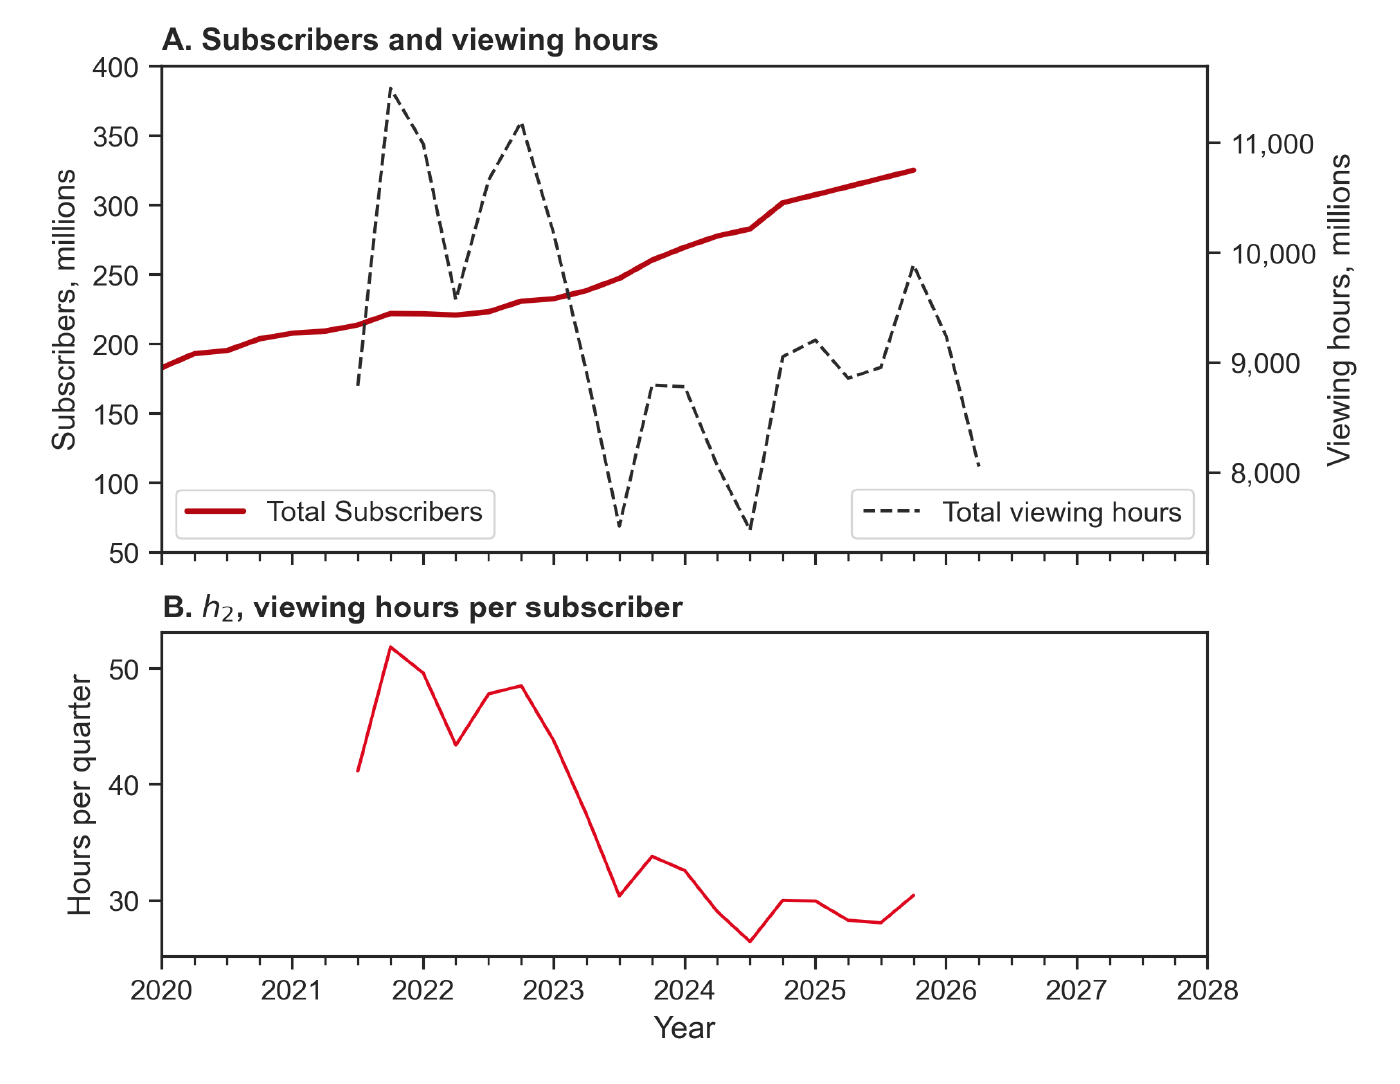
Figure 4 visualizes the measurement of h2. Panel B shows that viewing hours per subscriber have declined from 2021 to 2026. If the average Netflix user was once watching the most popular titles about 50 hours per quarter — roughly 17 hours per month, 4 hours per week, or 35 minutes a day — they are, more recently, only watching popular titles around 30 hours per quarter. Total viewing hours of popular titles noticeably dropped after 2023-Q1. Prior to this date, television seasons of Squid Game and Stranger Things, as well as Don’t Look Up and Glass Onion: A Knives Out Mystery, two successful Netflix-produced films, helped financial quarters have total viewing hours above 11 billion. New seasons of Squid Game would produce spikes of popularity after 2023-Q1, but no subsequent quarter has broken the 10-billion-viewing-hours barrier.
Source: See Table 2.
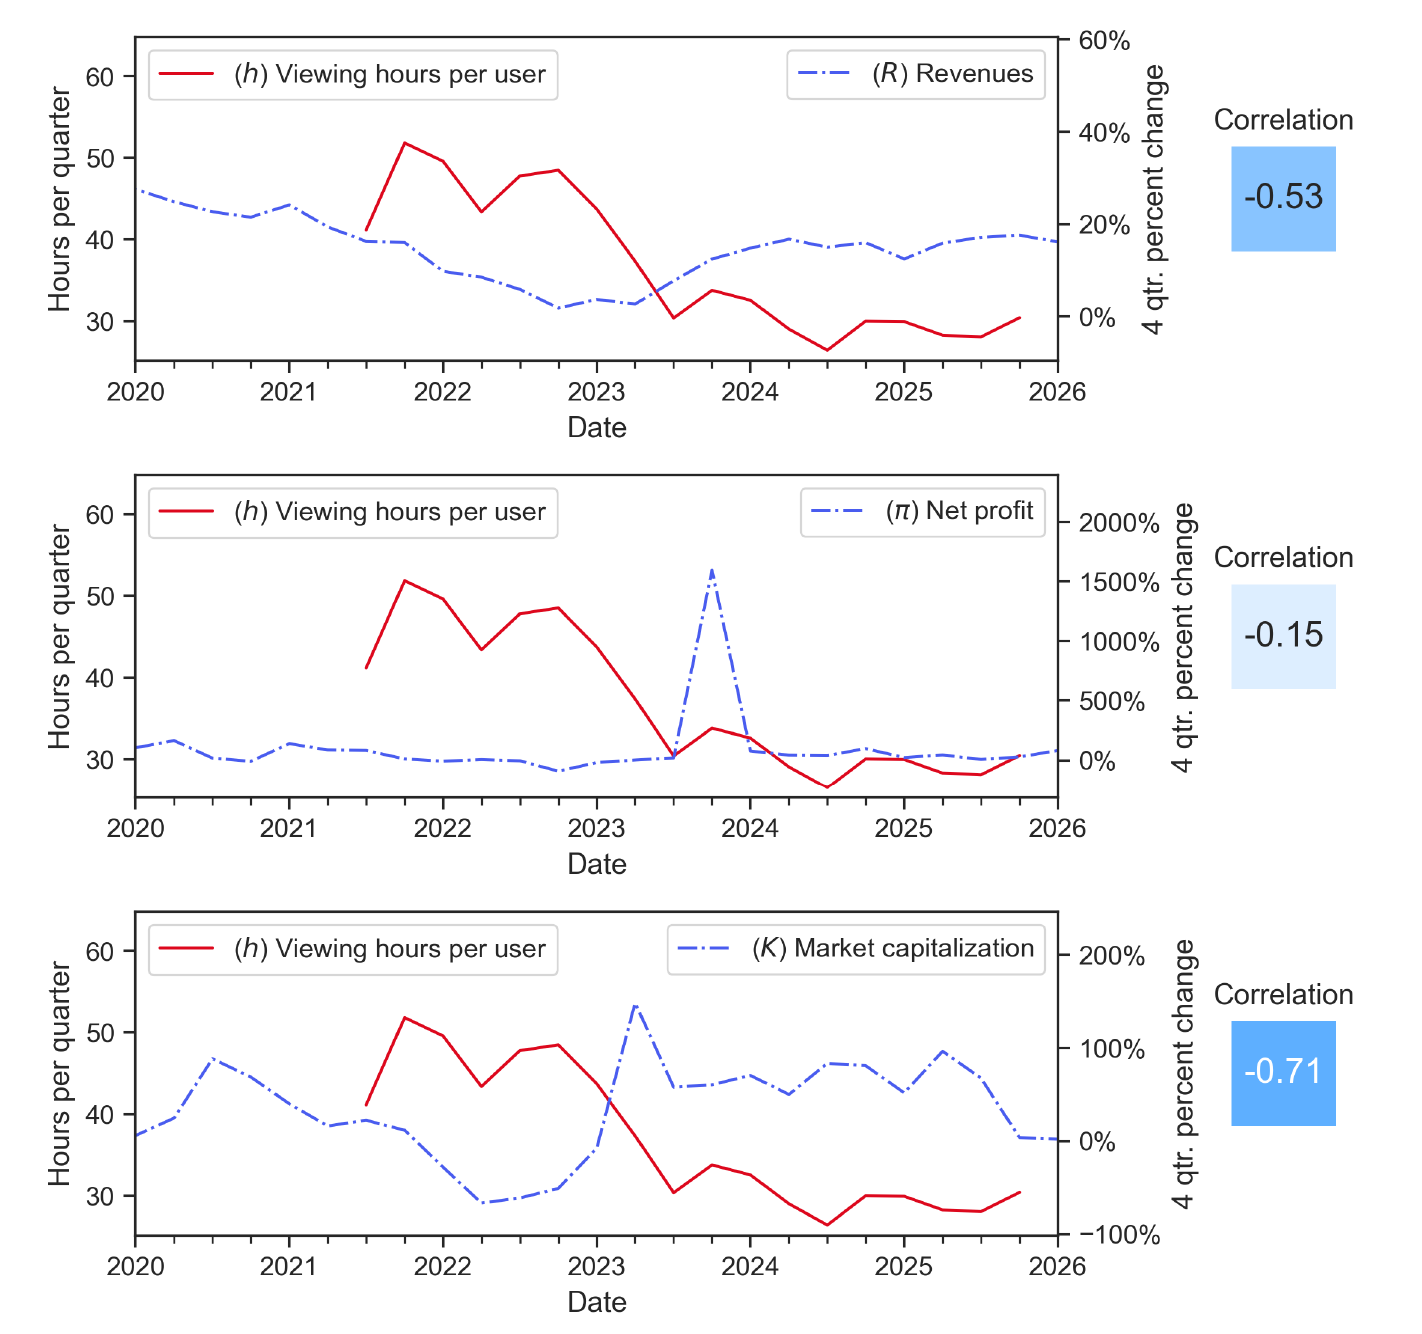
Figure 5 plots h2 beside the three series that we are using to test the relationship between user characteristics and Netflix’s financial performance. All three correlations are negative. Excluding the correlation with net profit, which can be left out for being too weak, a decline in viewing hours per subscriber correlates with rises in revenues and, unlike in h1, market capitalization. The negative correlation with market capitalization adds another layer to the mystery that began with revenues and h1. Why would the market value of Netflix increase when the average subscriber has reduced their time spent on the platform?
Source: See Table 2. Compustat for quarterly revenues, net income, and market capitalization of Netflix.
I believe we can only begin to find a reasonable answer when we reject the instinct to analyse subscriber behaviour through the lens of economic utility. Analyses of Netflix vary in the use of quantitative data, but different arguments about Netflix’s use value, whether more qualitative or quantitative, are versions of the same impulse: Netflix is doing something to increase pleasure and extend the time subscribers spend on Netflix. The first “something” is the promotion of binge-watching (Jenner, 2016). Binge-watching might be the first true source of Netflix’s ascendancy to cultural and financial dominance. By making entire seasons House of Cards and other television shows available on their first day of release, Netflix created opportunities for fans to binge content — sometimes all in one day. The second “something” is Netflix’s use of machine learning and other algorithms in user-interface design (Tang & Wei, 2023). Part of the reason why the Netflix app stays open on televisions, tablets, and phones is because a set of algorithms recommend content and automate the next play when the credits roll.
The issue is not about whether binge-watching and recommendation algorithms have real or illusory effects on the pleasure of using Netflix. Shows like Squid Game have been binge-watched by many, and it is also entirely possible that recommendation algorithms reduce the friction involved with browsing and selecting digital content from a screen of options. Rather, the problem is that gains or loses of subjective pleasure cannot be measured directly, especially at the scale of mass consumption. For something observable to be treated as the symptom of individual utility, we must be confident that the causal relationship is stable and proportional. In other words, if we indirectly measure increases or decreases of x through observable changes with y, the indirect measurement crumbles with every suspicion that y can move independently of x.
Unfortunately this is where neo-classical economics jumps in with two feet and eyes closed. Price, which can be observed, becomes the universal sign of subjective pleasure. Yet in addition to assumptions of price equilibrium, the assumption that prices reveal subjective pleasures has to barricade itself against possibilities that prices are not proportional to utility or have no utility at all.1
Utility is not only impossible to measure directly, its very meaning is warped by capitalist power. The consumer that freely chooses to subscribe to Netflix or not is, in the absence of a larger freedom to determine the social conditions that shape the production and distribution of culture, free only in an abstract sense. As Marcuse noted in his critical study of hedonism, emphasis on the subjectivity of pleasure comes at the cost of being unable to
distinguish between true and false wants and interests and between true and false enjoyment. [The subjective concept of hedonism] accepts the wants and interests as simply given and as valuable in themselves. Yet these wants and interests themselves, and not merely their gratification, already contain the stunted growth, the repression, and the untruth with which men grow up in class society (Marcuse, 1968).
When we apply Marcuse’s argument to the analysis of Netflix, the point is not to simply label Netflix as false enjoyment. Rather, Marcuse’s point is that under general conditions of unfreedom, one’s choice to watch Netflix over paid and free alternatives — e.g., other streamers, cable television, reading, camping, walking — is compromised as a rational calculation. The pleasure of subscribing to Netflix could be a symptom of how leisure time in capitalism functions in the repression of the democratic freedom to determine needs and wants. In other words, Netflix could be popular because so many alternatives for leisure time are unrealistic or unlikely under given structures. The average person in capitalism has only so much free time, disposable income, and, perhaps, aesthetic imagination to utilize for leisure.
Dominant as it is, Netflix cannot structure leisure time on its own. What it can do is use its monopoly position to compete against types of leisure activities that are technologically or socially incompatible with the passive act of watching television. As Veblen noted, the monopolization of a business sector changes the target of selling:
Not all advertising is wholly competitive, or at least it is not always obviously so. In proportion as an enterprise has secured a monopoly position, its advertising loses the air of competitive selling and takes on the character of information designed to increase the use of its output independently. But such an increase implies a redistribution of consumption on the part of consumers. So that the element of competitive selling is after all not absent in these cases, but takes the form of competition between different classes of wares instead of competitive selling of different brands of the same class of wares (Veblen, 2006, p. 58-59).
Like other business enterprises, Netflix uses advertisements — mainly trailers for new films and shows — to increase sales, but, to Veblen’s point, the true frontier of its selling strategy is other leisure-time activities.
To see this more clearly, let’s assume for the moment that competitive selling simply works and the consumer that watches a trailer for a new Netflix film or TV show will pay Netflix to consume it. Even in this idealized scenario of mindless consumerism, Netflix’s advertisements act on at least four types of consumers:
- Already subscribed to Netflix. Competitive selling redistributes their attention on the Netflix platform. These consumers are already paying a subscription fee to Netflix, so the force of competitive selling influences them to watch some films and shows instead of others.
- Subscribed to other streaming platforms. Competitive selling causes someone who regularly spends time on streaming platforms to join Netflix. They join Netflix by increasing their streaming subscription budgets or they substitute Netflix for another streaming service, such as Disney+.
- Infrequently uses streaming subscriptions. Joining Netflix is a change in how they pay for TV. The common phrase associated with this change is “cord cutting”, which means that digital streaming services replace subscriptions to network and cable television (with its cords and boxes). In this case, competitive selling has convinced someone to join Netflix and cut the cord.
- Spends little time watching TV. Competitive selling causes someone to fundamentally change their cultural habits. They have to do less of something else to watch more TV. Joining Netflix is a win not just for one streaming platform, but for all dominant firms in film and television.
There are many ways to label Netflix consumers, but this organization groups them based on how the draw of something on Netflix changes behaviour. For some the change is negligible — they are already there on the platform and any change is one of personal taste. Others are pulled from longer “distances” — their transformation involves leaving behind and forgetting other areas of leisure time.
Competitive selling of the first type is likely to create little more than short-term gains in the capitalization of Netflix. Essentially, a capitalist might only have brief interest in what active Netflix subscribers are watching, as these subscribers are already accounted for in the capitalization of earnings. Moreover, when a film or TV show becomes a massive hit, the capitalist primarily values the hit for what it will create for future expectations. In other words, the consumer behaviour that first turned properties like Squid Game or Stranger Things into hits quickly become statistics of their past successes. To the extent that these shows can carry bigger dreams of exploiting future seasons, more merchandise, and possible spinoffs, Squid Game and Stranger Things are valuable for their ability to secure or increase future streams of income.
Announcements of new films and shows on Netflix will cause some to join the platform. This is undoubtedly a desirable effect of competitive selling. But the gain of new subscribers can be short lived. A risk is that someone joining Netflix for specific content can unsubscribe the moment the purpose is served. It is also possible that the start and end of one’s subscription to Netflix is a budgetary juggling act, where the subscription to one streaming service is stopped to pay for another.
Monopolization of mass culture does not wholly eliminate the ability for a consumer to switch between products or brands. Someone can join Netflix, cancel Disney+, and then, later on, cancel Netflix, rejoin Disney+, but also begin an Apple TV+ subscription. However, the cycle of subscriptions need not be a simple repetition of gains and loses cancelling each other. A firm like Netflix can grow a differential advantage when, in the changes people make to their TV subscriptions, the probability of joining Netflix is higher than other streaming services, and the probability of leaving Netflix is lower than other streaming services.
Figure 6 shows us that Netflix became a substitute product for cable TV in the United States. As domestic subscribers to Netflix grew in the 2010s, cable television subscriptions in the United States fell from a high point of around 100 million subscriptions. In the 2020s, cable TV subscriptions continued to fall and Netflix became the one with the most subscribers. As of 2025, there is no indication of a counter-cycle, whereby the trajectories of Netflix and cable television subscriptions reverse. As demonstrated in a Pew Research Center survey, it was estimated in 2025 that 55% of Americans watch streaming services and hold no subscriptions to cable or satellite TV (Pew Research Center, 2025). It was estimated that only 8% of Americans do the opposite by having cable or satellite subscriptions and no subscriptions to streaming services.
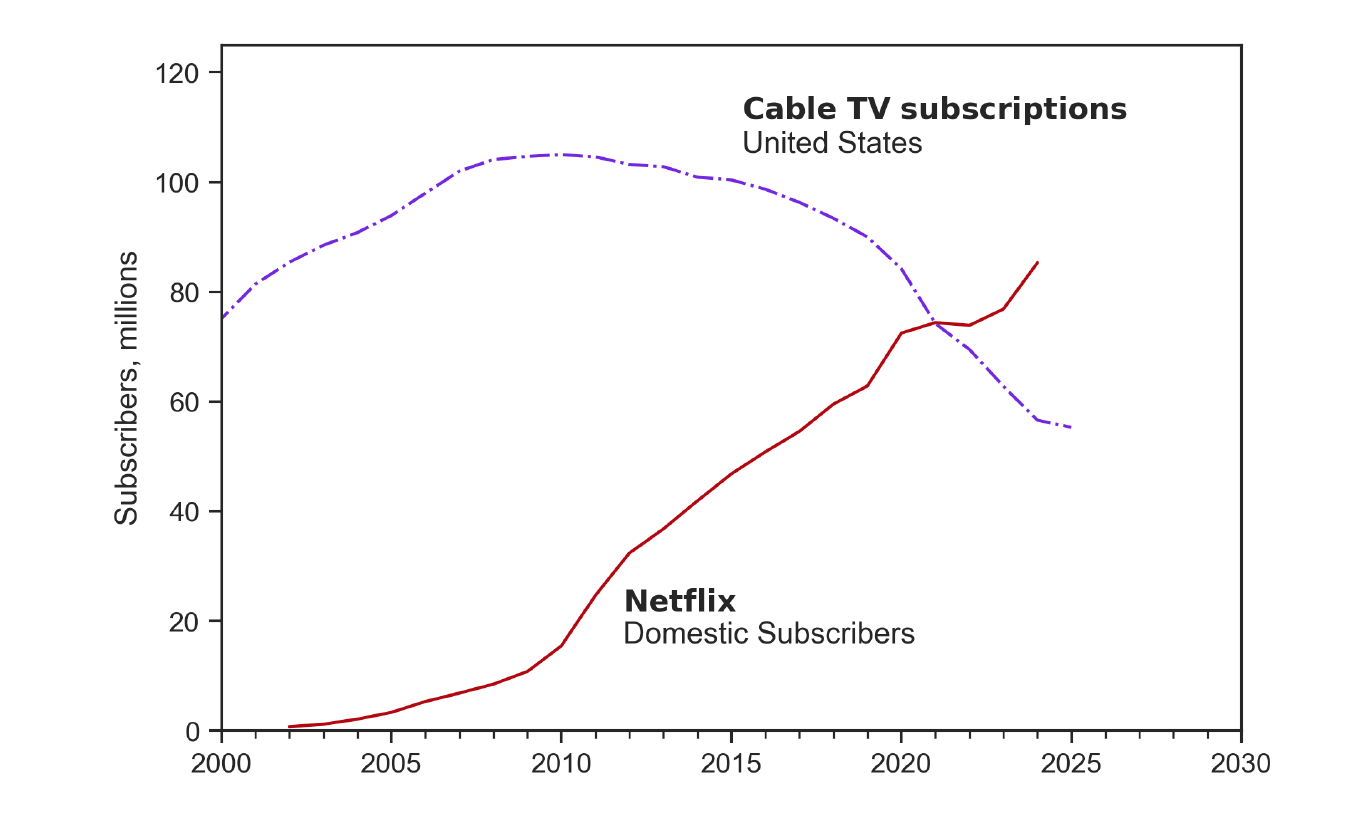
Source: IBISWorld for number of cable TV subscriptions; Netflix financials for number of domestic subscribers.
Figure 7 suggests that Netflix’s retention of subscribers is challenged by subscription switching within digital streaming. The top panel shows the subscriber numbers of Netflix and Disney+, which launched in November 2019. The bottom panel plots the difference between their subscriptions. It is entirely possible that the U-shape of the series is one phase of a wave-like pattern that will continue in the future. Yet it is also to Netflix’s advantage that, even in this scenario, it ended this potential phase with a net gain. Netflix had roughly 150 million more subscribers than Disney+ in 2020, only 66 million more subscribers at the end of 2022, and 193 million more subscribers by the end of 2025.
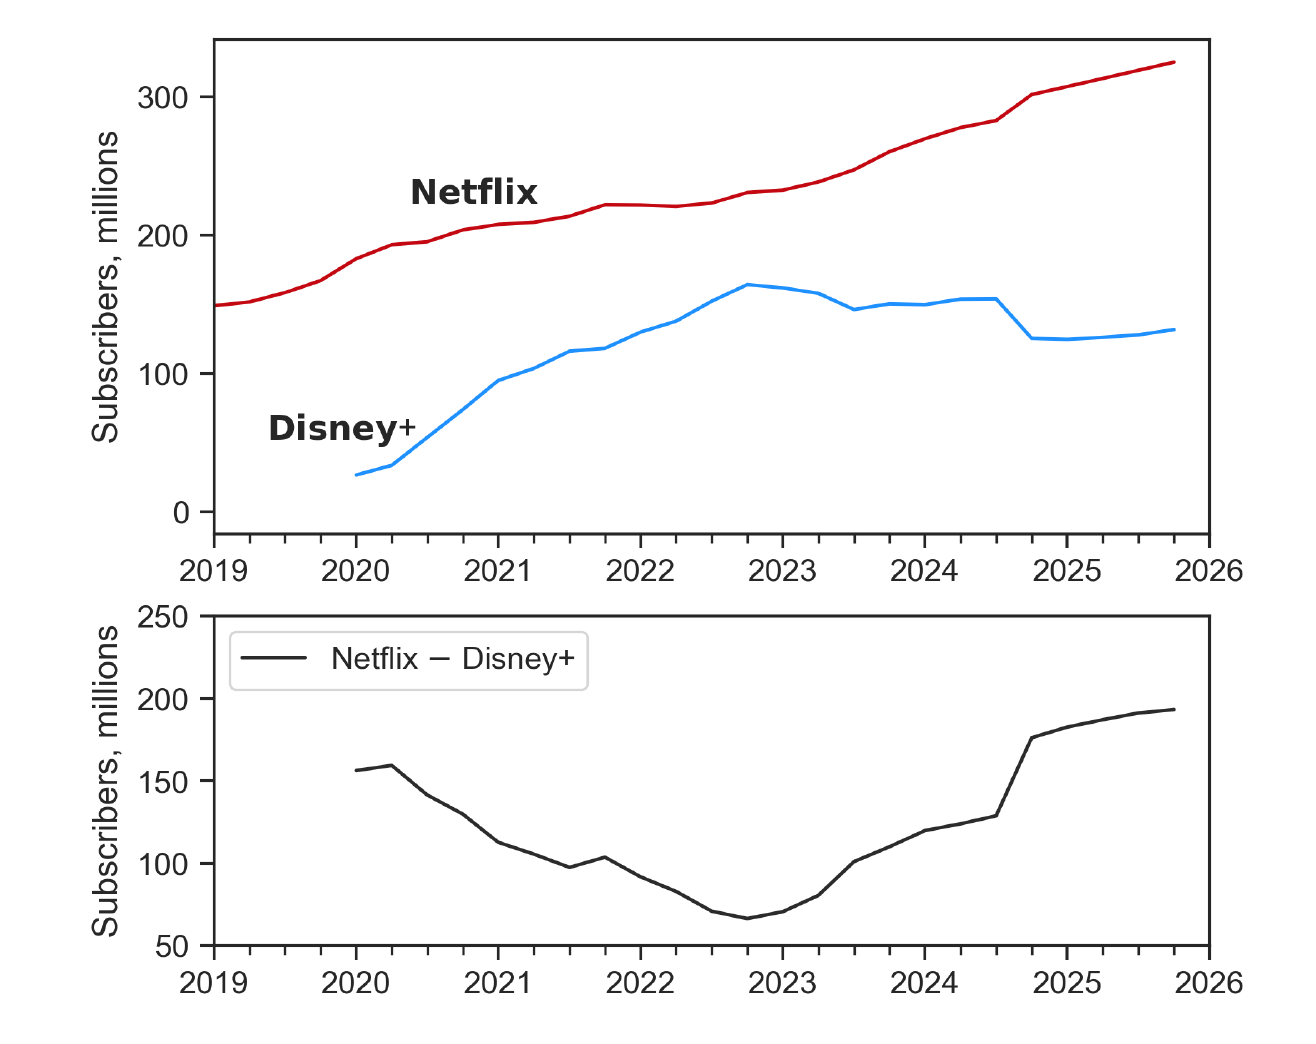
Source: Statista for Disney+ subscriptions; Table 2 for number of Netflix subscribers.
It might appear to some that utility is still the key ingredient in this consideration of how Netflix gains subscribers through competitive selling. For instance, young adults in America could have eschewed cable TV subscriptions because Netflix had preferred titles and a more convenient digital service. The aggregate outcome of Americans rejecting cable TV for Netflix can be observed, but the so-called economic rationality of this preference comes with a lot assumptions and certainly must ignore Marcuse’s critical theory of hedonism. For instance, how did Netflix first become so popular with the youth of the United States? We might answer this question with an underlying assumption of technological serviceability. Millennials and Gen Z grew up with the internet, social media, tablets and small screens. What Netflix offered was a distribution service that resonated with their digital media habits.
But what about youth unemployment? If we take this into consideration, the preference for Netflix can only maintain its rational character with a belief that choices of personal expenditure in poor economic conditions are just as “free” as the consumer choices of those in better situations. Figure 8 plots the 4-quarter domestic subscriber gains of Netflix against the US quarterly unemployment rate for the 16-24 year age group.2 The three largest gains in domestic subscribers occurred during periods of high or rising youth unemployment:
- The years after the 2008 financial crisis
- The COVID-19 Pandemic
- Rising youth unemployment from 2023 to 2026
The last period is notable for having a proportionally larger subscriber spike than the increase in youth unemployment. But the influence of youth unemployment, even if only partial, shows how “it does not follow that the highest serviceability gives the largest gains to the business man in terms of money …” (Veblen, 2006, p. 51).
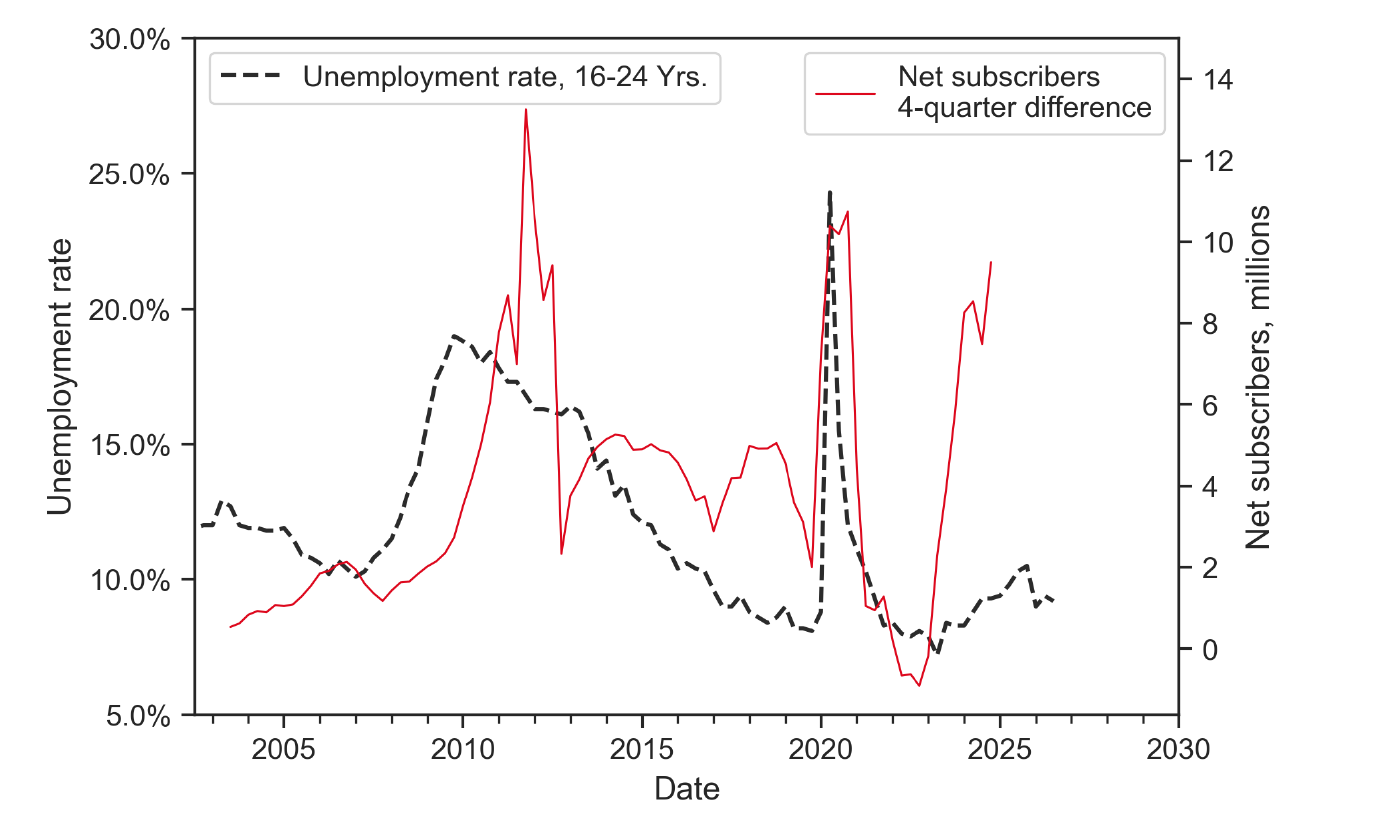
Source: Source: FRED for U.S. Bureau of Labor Statistics, Unemployment Rate – 16-24 Yrs. [LNS14024887]; Netflix financials for number of domestic subscribers.
The example of Netflix benefiting from the negative effects of youth unemployment — no job, nothing to do — is just one of a type that challenges the strength of a utility theory. As applications of the capital-as-power approach have shown, capitalists have achieved great financial successes with the socially destructive strategies of artificial shortages, inflation, unemployment, punishment, and war (Baines, 2014; Bichler & Nitzan, 2014, 2023; Fix, 2019; Mouré, 2023). Nitzan and Bichler utilize Veblen to argue that it is our assumptions about productivity that make us see the destructive powers of capitalist ownership as marginal exceptions in our ideas about capitalism. Nitzan and Bichler acknowledge that productivity is still a factor in capitalism, but neo-classical economics has inflated and misappropriated it as a characteristic of business:
Is it not true that in order to profit, business enterprise needs to promote industrial creativity, productive ingenuity and “best practices”? The answer is not really. Strictly speaking, business cannot “promote” industry. At most, it can unleash it — and even that it does only up to a point and under very specific conditions. Earnings do depend on output — but not on any type of output and not only on output. Moreover, the dependency is non-linear and sometimes inverted, which is why Veblen referred specifically to strategic sabotage.
Seen as an entire social order, business enterprise certainly is far more “productive” than any earlier mode of social organization. Yet, in Veblen’s opinion, the immense productive vitality of this social order is an industrial, not a business phenomenon. Business enterprise is possible only in conjunction with large-scale industry, though the reverse is not true …. The practices of business of course are closely related to industry, but only in point of control, never in terms of production and creativity. From this a priori vantage point, business per se is distinct from industry and therefore cannot boost industry, by definition. Even companies in possession of cutting-edge technology cannot promote industrial creativity; instead, they can merely relax – usually for a hefty fee – some of the constraints that would otherwise limit creativity. (Nitzan & Bichler, 2009, p. 232)
Veblen’s differentiation between business and industry is crucial to seeing the breadth of opportunities to capture of our fourth consumer type — the subscriber who once spent little time watching TV. Take, for example, the historical decline of reading as a leisure activity. As shown in Figure 9, Americans regularly watched more television and read less for pleasure from 2003 up until 2024. The average hours Americans spent watching television did drop after 2024, but average TV time was still around ten times the length of reading time.
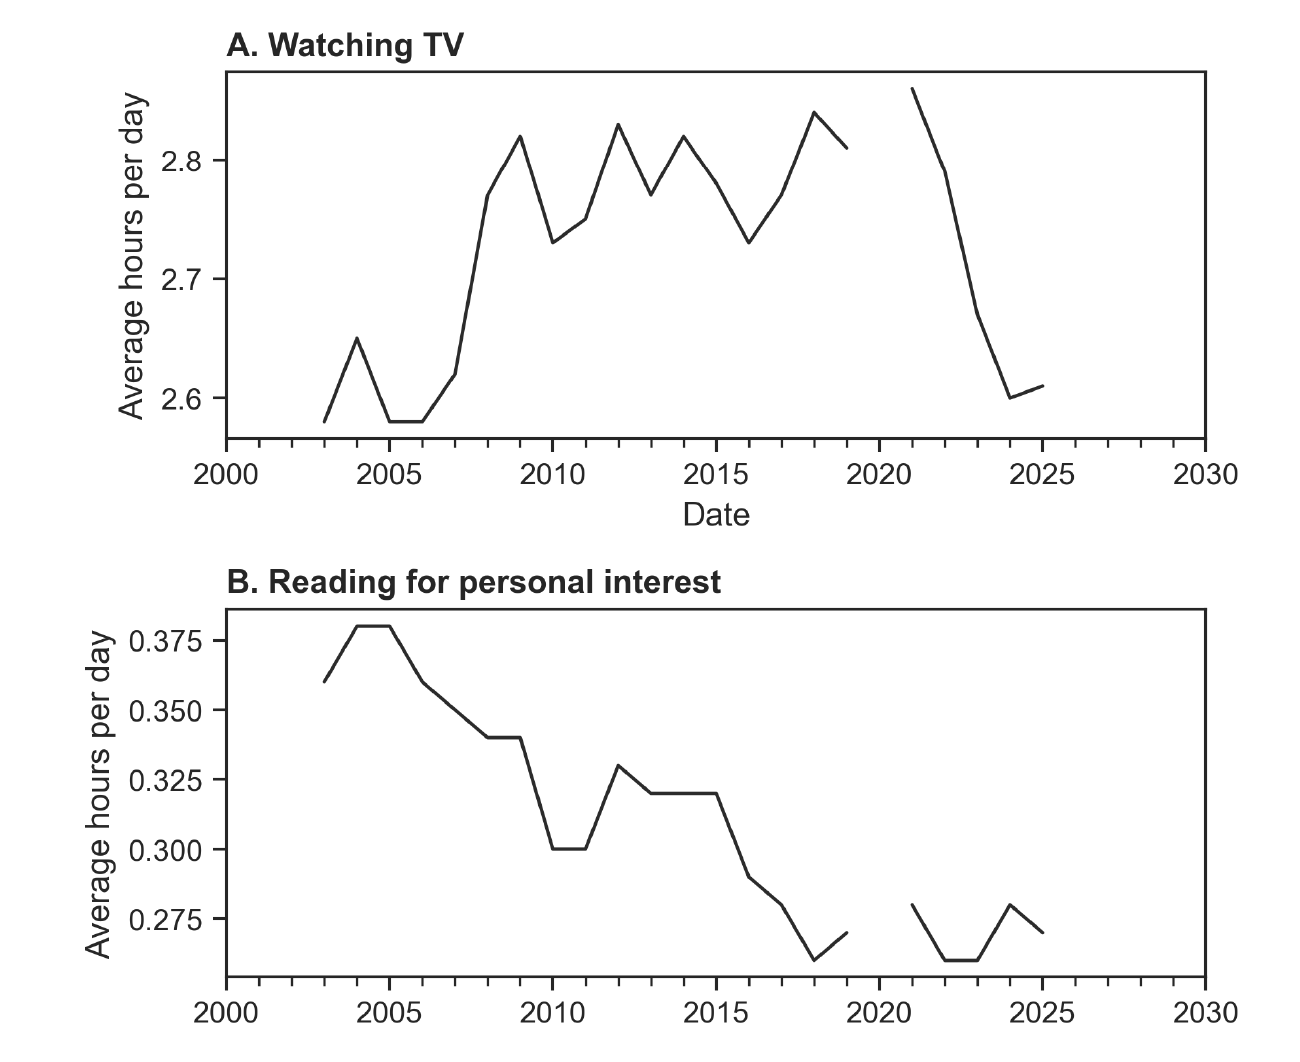
Source: US Bureau of Labour Statistics for American Time Use Survey, Table A- 1 “Time spent in detailed primary activities and percent of the civilian population engaging in each detailed primary activity category, averages per day by sex, annual averages, total.”
Netflix only has a partial role in this change in American leisure activity; a decline in reading in the 2000s would be influenced by, among other things, advances in digital technology and the quality of education. But even if Netflix cannot depress reading in the United States on its own, it can utilize its power over the social creativity of industry to:
- Have form and content that is anti-literature. Acclimate subscribers to a pace and style of television that makes reading feel like a slow, frustrating activity.
- Disincentivize audiences to read the source material of adaptations. Build a film and television culture based on substitution, where there is no need to read the original book. Netflix can advertise the literary quality of source material, but the firm can make a minimal effort to persuade someone to actually go read it. (These efforts are made by book publishers and booksellers.)
These powers can seem insignificant until we analyse the ways Netflix has gained from the speed of reading’s relative decline. Figure 10 on its left axis plots the ratio of American television watching to reading for leisure. This shows the relative size of television’s gains to the decline of reading. The right axis shows the level of Netflix’s domestic subscribers. The similar shapes of the series suggest that the rate of substitution of reading for television has, at least up until 2024, advantaged the growth of Netflix subscriptions. In this light, Netflix has had an incentive to take part in the destruction of reading culture in the United States. This destruction need not be total, and certainly there are some Netflix subscribers with strong reading habits. But in terms of how Netflix, as a business, strategically sabotages the social creativity of film and television production, there are benefits to building greater incompatibilities between television watching and reading. And some of these incompatibilities might not exist or be as pronounced in the absence of capitalist ownership. Aesthetic and technological differences between film, television, and literature do not, on their own, prevent artists from creating harmonies of media.
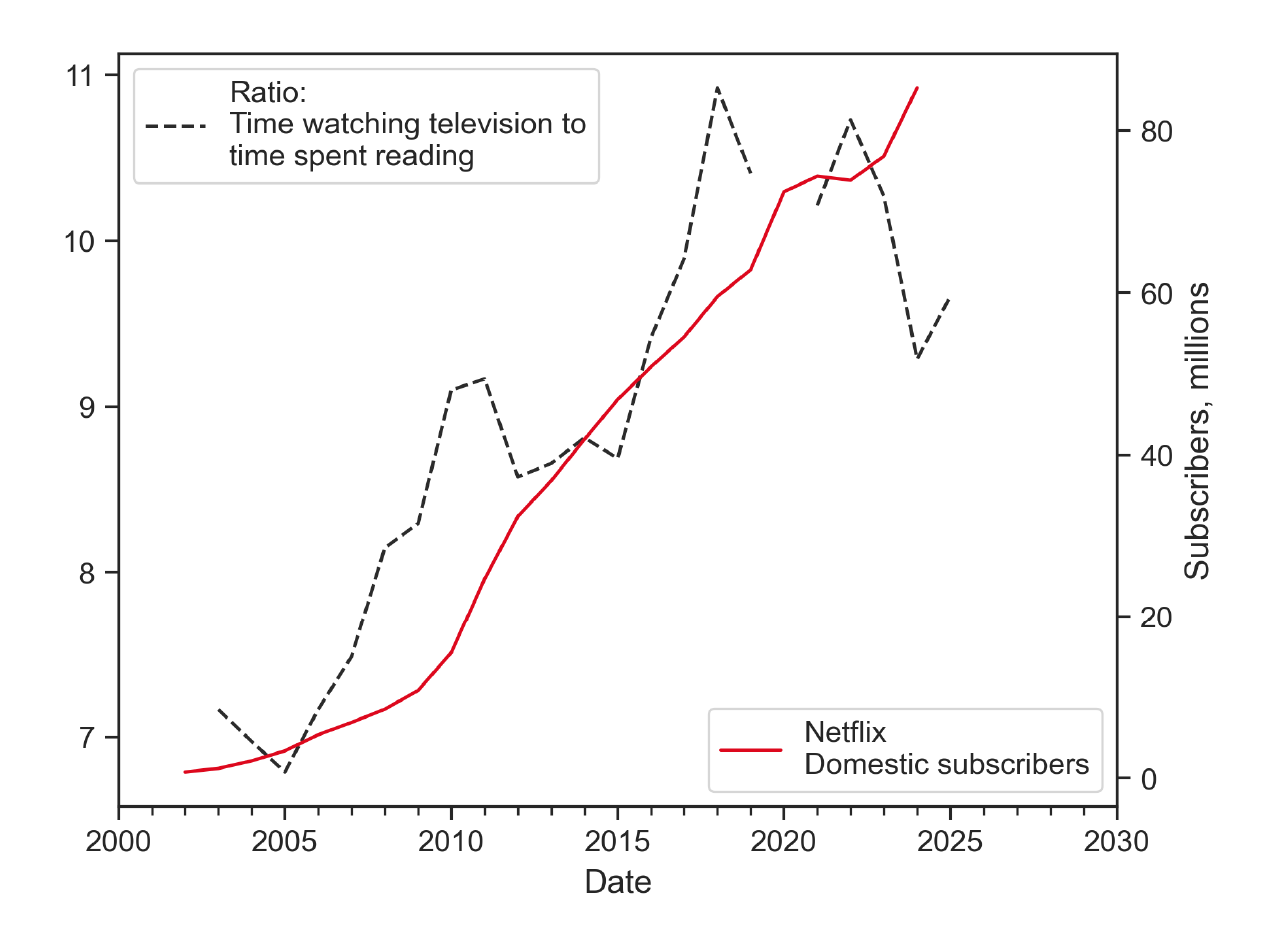
Source: US Bureau of Labour Statistics for American Time Use Survey, Table A- 1 “Time spent in detailed primary activities and percent of the civilian population engaging in each detailed primary activity category, averages per day by sex, annual averages, total; Netflix financials for domestic subscribers.”
So how do we circle back and interpret Figure 5? If it is absurd to interpret the negative correlation between hours watched and market capitalization with a theory of utility, it seems just as absurd to say that Netflix’s financial gains have to be negatively correlated to viewing hours. Veblen, Marcuse, and Nitzan and Bichler provide us with the means to explore a more reasonable interpretation. The reasons someone spends a lot of time on Netflix are subjective, and they are incidental as long as subscribers keep paying Netflix at the prices it can charge. Subscribers could derive less pleasure from Netflix as the years go by, or they could already be using the platform from a place of complete boredom — these evolutions are social and, on their own, do not change Netflix’s position as a business that derives income through its power over industry. In addition to giving Netflix an ability to limit and withhold the art of film and television from the community at large, capitalist power gives Netflix the ability to refrain from relentlessly competing for cultural significance through the quality of its outputs. Ownership, and in particular the size of its ownership, can also give Netflix opportunities to gain subscribers through its participation in the destruction of culture.
Footnotes
- Indirect measurement is not just a problem for neo-classical economics. Marxist methods cannot measure socially necessary abstract labour time directly. If wage and commodity prices are treated as the means to indirectly measure labour and surplus value, the indirect method is already undermined when it is possible for some commodities to have prices but no value, or for there to be commodities like diamonds, which Marx thought never had values proportional to their prices (Marx, 1990, p. 130). In (McMahon, 2022), especially Chapter 3, I critically analyse a variety of Marxist solutions to methodological issues with measuring of socially necessary abstract labour time in the production of cultural commodities. ↩︎
- The shape of the US unemployment rate for the 16-24 age group is similar to the 25-54 year age group, as well as the unemployment rate of the general population. Data for the 16-24 age group is used to remove doubt about what a broader population statistic could hide about American youth unemployment. ↩︎
References
Baines, J. (2014). Food Price Inflation as Redistribution: Towards a New Analysis of Corporate Power in the World Food System. New Political Economy, 19(1), 79–112.
Bichler, S., & Nitzan, J. (2014). No Way Out: Crime, Punishment and the Capitalization of Power. Crime, Law and Social Change, 61(3), 251–271.
Bichler, S., & Nitzan, J. (2023). Blood and Oil in the Orient: A 2023 Update. Retrieved 2024-03-01, from https://bnarchives.yorku.ca/809/ 2/20231110_bn_blood_and_oil_in_the_orient_2023_rwerb.htm
Fix, B. (2019). Personal Income and Hierarchical Power. Journal of Economic Issues, 53(4), 928-945.
Jenner, M. (2016). Is this TVIV? On Netflix, TVIII and binge watching. New Media & Society, 18(2), 257-273.
Marcuse, H. (1968). On Hedonism. In J. J. Shapiro (Trans.), Negations: Essays in Critical Theory (pp. 159–200). Boston, MA: Beacon Press.
Marx, K. (1990). Capital: A Critique of Political Economy (Vol. 1; B. Fowkes, Trans.). New York: Penguin Books.
McMahon, J. (2022). The political economy of Hollywood: Capitalist power and cultural production. Routledge.
Mouré, C. (2023). Technological Change and Strategic Sabotage: A Capital as Power Analysis of the US Semiconductor Business. Real-World Economics Review, 103, 26-55.
Nitzan, J., & Bichler, S. (2009). Capital as Power: A Study of Order and Creorder. New York: Routledge.
Pew Research Center. (2025, July). 83% of U.S. adults use streaming services, far fewer subscribe to cable or satel lite TV. Retrieved from https://www.pewresearch.org/short-reads/2025/07/01/ 83-of-us-adults-use-streaming-services-far-fewer-subscribe -to-cable-or-satellite-tv/
Robinson, J. (2017). Economic Philosophy. New York: Routledge.
Tang, W., & Wei, M. (2023). Streaming media business strategies and audience- centered practices: a comparative study of Netflix and Tencent Video. Online Media and Global Communication, 2(1), 3-24.
Veblen, T. (2006). The Theory of Business Enterprise. New Brunswick, NJ: Transaction Publishers.


